Healthy food availability in 2014
The Healthy Food Access Basket (HFAB) survey measured the cost and availability of food in Queensland in 2014. The 2014 HFAB contains 49 healthy food items, while the original basket contained 44 food items. The availability of 15 fruits and 15 vegetables was also collected.
Vegetables
The availability of 15 vegetables was collected. The vegetables were: potatoes, tomatoes, onions, lettuce, pumpkin, cabbage, cauliflower, green beans, carrots, broccoli, sweet potatoes, capsicums, mushrooms, sweet corn and cucumbers.
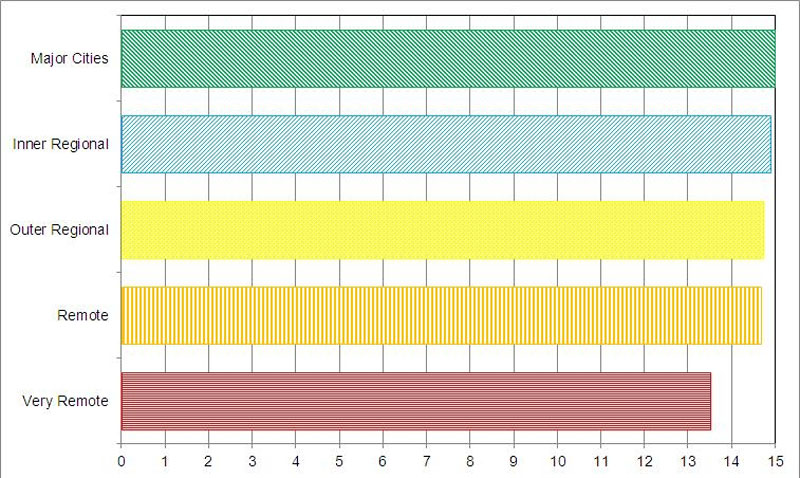
In 2014, stores in the 10 major city locations stocked all 15 vegetable varieties. Very remote stores stocked the least with on average 13.5 (90.0%) vegetable varieties.
Nearly all vegetable varieties were stocked in other areas, with 14.9 varieties on average in inner regional stores, and 14.7 varieties on average in outer regional and remote stores.
Figure 21: Average availability of vegetable varieties in 2014
Source: Healthy Food Access Basket Survey 2014, Queensland Government Statistician's Office, Queensland Treasury and Trade.
© The State of Queensland (Queensland Treasury and Trade) (2014). Creative Commons: BY. This figure is suitable for Open Data.
Fruit
The availability of 15 fruits was collected: apples, bananas, rockmelon, peaches, pears, pineapples, grapes, strawberries, oranges, watermelon, mangoes, pawpaw, kiwi fruit, other stone fruits and other citrus fruits.
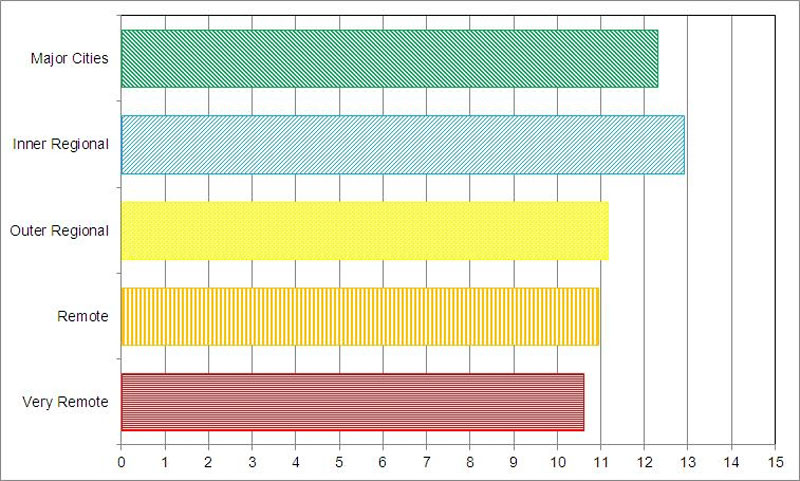
In 2014, the average availability of the fruit varieties was lowest at 10.6 (70.7%) varieties in very remote stores and highest at 12.9 (86.0%) varieties in inner regional areas.
Major city stores stocked 12.3 (82.0%) varieties, outer regional areas had 11.2 (74.7%) fruit varieties, and remote stores had 10.9 (72.7%) varieties available.
Figure 22: Average availability of fruit varieties in 2014
Source: Healthy Food Access Basket Survey 2014, Queensland Government Statistician's Office, Queensland Treasury and Trade.
© The State of Queensland (Queensland Treasury and Trade) (2014). Creative Commons: BY. This figure is suitable for Open Data.
Foods not available in 2014
In 2014, stores in major cities were missing, on average, 3.6% (1.6 items) of the food items in the original basket, and only 2.7% (1.3 items) of the food items in the 2014 basket.
For all other locations, there were a greater proportion of foods missing from the 2014 basket compared to the original basket:
- Inner regional stores on average were missing 4.5% (2) of items in the original basket and 5.1% (2.5) of items in the 2014 basket.
- Outer regional stores on average were missing 4.5% (2) of items in the original basket and 5.3% (2.6) of items in the 2014 basket.
- Remote stores on average were missing 4.3% (1.9) of items in the original basket and 5.3% (2.6) of items in the 2014 basket.
-
Very remote stores on average were missing 8.2% (3.6) of items in the original basket and 10.8% (5.3) of items in the 2014 basket.
Figure 23: Average number of missing items in original and 2014 Healthy Food Access Basket in 2014
Source: Healthy Food Access Basket Survey 2014, Queensland Government Statistician's Office, Queensland Treasury and Trade.
© The State of Queensland (Queensland Treasury and Trade) (2014). Creative Commons: BY. This figure is suitable for Open Data.
Number of stores with all foods in the basket in 2014
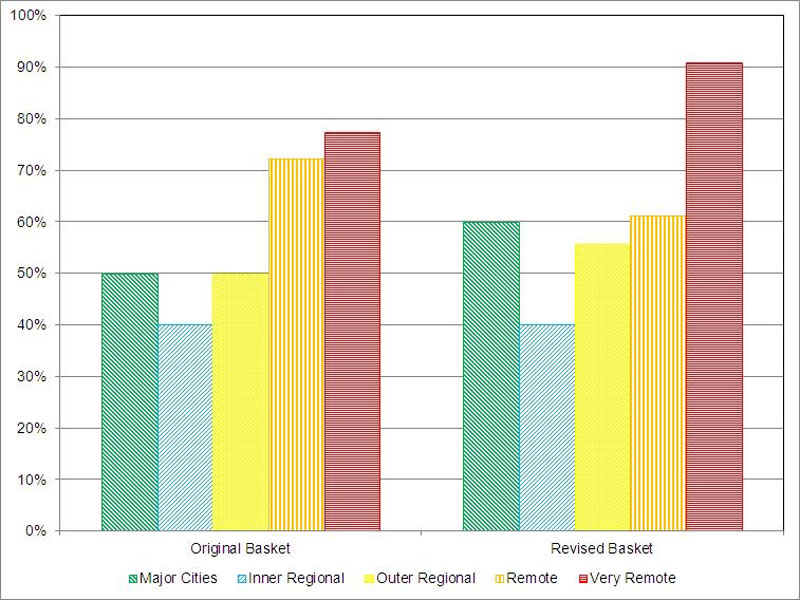
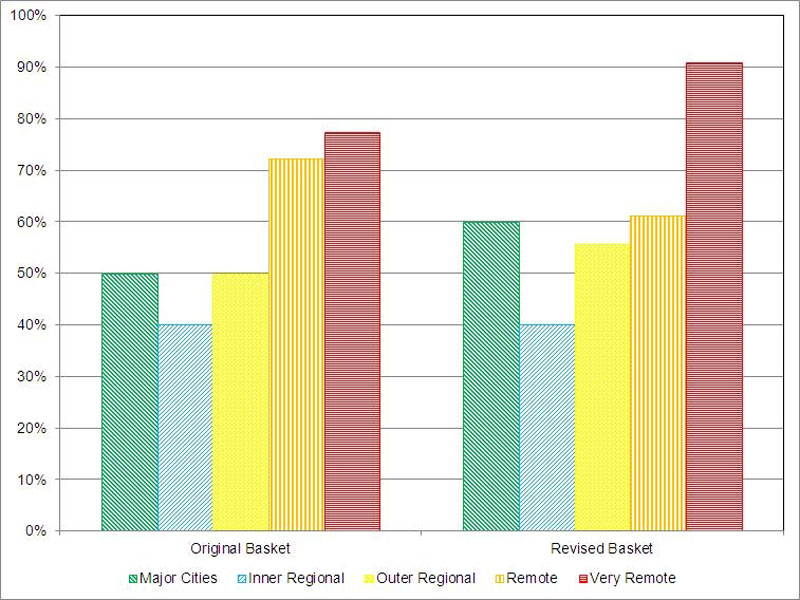
Of stores in the major cities in 2014, 50.0% were missing at least 1 item from the original basket and 60.0% were missing at least 1 item from the 2014 basket.
In very remote areas more than three-quarters (77.3%) of stores were missing at least 1 item in the original basket and almost all stores (90.9%) were missing at least 1 item from the 2014 basket.
Inner regional stores were the least likely to be missing at least 1 item, with 40% of stores missing items from the original basket and 40% of stores missing items from the 2014 basket.
At least 1 item in the original basket was missing in 50% of outer regional stores, while 55.6% of outer regional stores were missing at least 1 item from the 2014 basket.
Remote stores differed from the other locations as while 72.2% of stores were missing at least 1 item from the original basket, only 61.1% of stores were missing items from the 2014 basket.
Figure 24: Percentage of stores with missing items in original and 2014 Healthy Food Access Basket in 2014
Source: Healthy Food Access Basket Survey 2014, Queensland Government Statistician's Office, Queensland Treasury and Trade.
© The State of Queensland (Queensland Treasury and Trade) (2014). Creative Commons: BY. This figure is suitable for Open Data.
Changes to availability of healthy foods over time
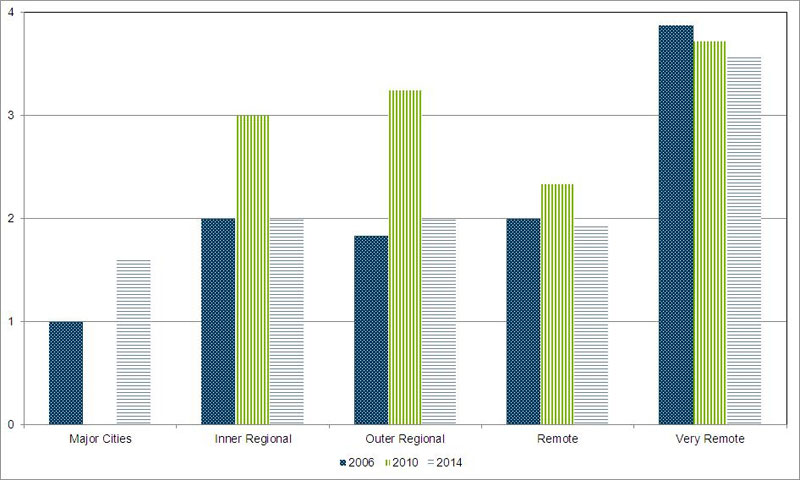
Between 2006 and 2014, the average number of missing items in the original HFAB increased in stores in the major cities, from 1 to 1.6 items.
Between 2006 and 2014, the average number of missing items in the original HFAB decreased in stores in very remote areas, from 3.9 to 3.6 items.
Although the average number of missing items in the original HFAB increased between 2006 and 2010 in inner regional, outer regional and remote stores, the number of missing items returned to approximately 2006-levels in 2014.
Figure 25: Average number of missing items in original Healthy Food Access Basket in 2006, 2010, and 2014
Averages for this figure have been calculated by dividing the number of missing items by the number of stores with at least 1 missing item. The number of stores therefore varies for each remoteness category and year. In 2010, all stores in the major cities were found to have at least 1 generic or brand item.
Source: Healthy Food Access Basket Survey 2014, Queensland Government Statistician's Office, Queensland Treasury and Trade.
© The State of Queensland (Queensland Treasury and Trade) (2014). Creative Commons: BY. This figure is suitable for Open Data.