Comparison of Healthy Food Access Basket 2006 to 2014
The Healthy Food Access Basket (HFAB) survey measured the cost and availability of 44 food items (including less healthy choices such as sugar, sausages, and canned meat) in Queensland in 2006, 2010, and 2014. The change in cost of the original HFAB over time is listed below.
Change in cost of the original HFAB
The 'Original Basket' uses the 6 person family structure (couple with 3 children and grandmother). Prices are not adjusted for inflation. Basket costs reflect the amount of food consumed over a 2 week period for the family structure described.
Between 2010 and 2014
The average cost of the original HFAB changed.
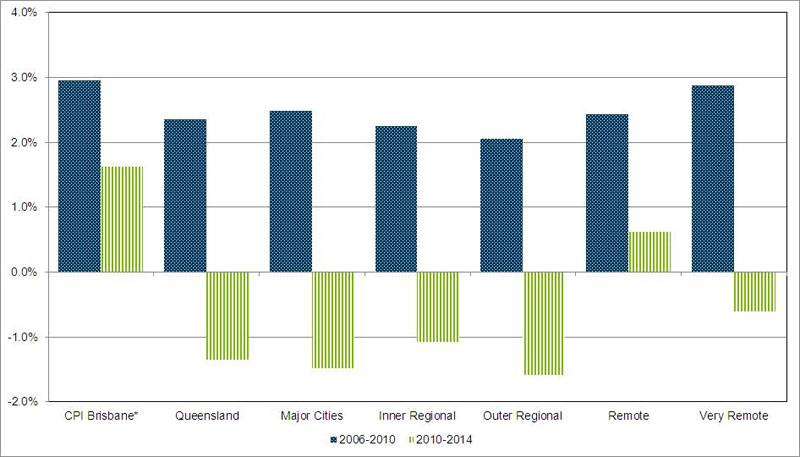
- Decreased in Queensland by 1.3% per year (CPI for Brisbane increased by 1.6% per year).
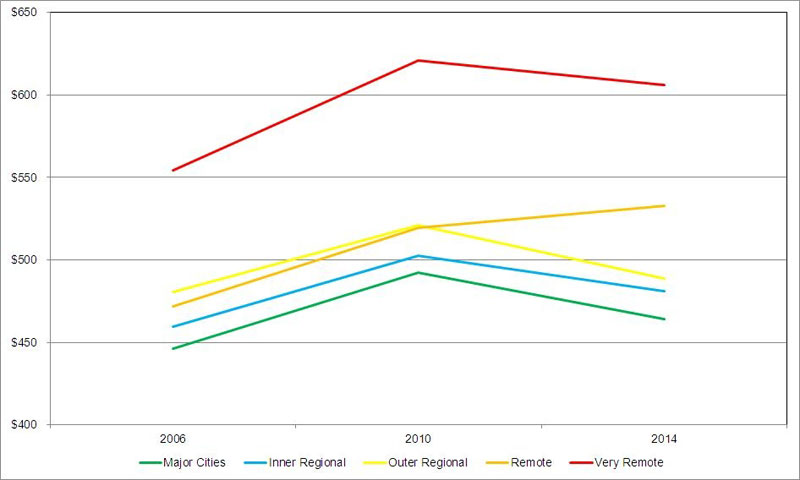
- Decreased in major cities by $28.54 (5.8%) or an annualised percentage change of 1.5% per year.
- Decreased in inner regional areas by $21.26 (4.2%) or an annualised percentage change of 1.1% per year.
- Decreased in outer regional areas by $32.32 (6.2%) or an annualised percentage change of 1.6% per year.
- Decreased in very remote areas by $14.90 (2.4%) or an annualised percentage change of 0.6% per year.
- Increased in remote areas by $13.08 (2.5%) or an annualised percentage change of 0.6% per year.
Between 2006 and 2010
The average cost of the original HFAB increased:
- In Queensland by 2.4% per year (CPI for Brisbane increased by 3.0% per year).
- In major cities by $46.15 (10.3%) or an annualised percentage change of 2.5% per year.
- In inner regional areas by $42.91 (9.3%) or an annualised percentage change of 2.3% per year.
- In outer regional areas by $40.66 (8.5%) or an annualised percentage change of 2.1% per year.
- In remote areas by $47.64 (10.1%) or an annualised percentage change of 2.4% per year.
-
In very remote areas by $66.53 (12.0%) or an annualised percentage change of 2.9% per year.
Figure 18: Average cost of original Healthy Food Access Basket in 2006, 2010 and 2014
Source: Healthy Food Access Basket Survey 2014, Queensland Government Statistician's Office, Queensland Treasury and Trade.
© The State of Queensland (Queensland Treasury and Trade) (2014). Creative Commons: BY. This figure is suitable for Open Data.
Figure 19: Annualised percentage change in average cost of original Healthy Food Access Basket
Source: Healthy Food Access Basket Survey 2014, Queensland Government Statistician's Office, Queensland Treasury and Trade.
© The State of Queensland (Queensland Treasury and Trade) (2014). Creative Commons: BY. This figure is suitable for Open Data.
Food groups
Fruit
The original HFAB included apples, oranges, bananas, canned fruit, and orange juice.
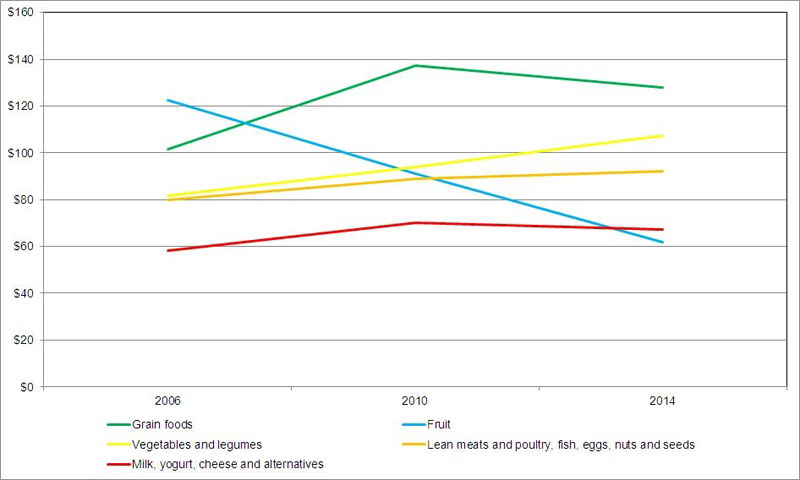
The average cost of these fruit items decreased by 25.5% (from $122.40 to $91.19) between 2006 and 2010, and then decreased again by 32.2% ($91.19 to $61.87) between 2010 and 2014.
Fruit is the only food group to steadily decrease in cost since 2006.
Vegetables and legumes
There were 11 fresh, canned and frozen vegetables and legumes in the original HFAB.
The cost of this food group increased by 14.9% ($81.84 to $94.01) between 2006 and 2010, and also increased between 2010 and 2014 by 14.2% ($94.01 to $107.40).
Meat, eggs, seeds, and nuts
The cost of lean meats, poultry, fish, eggs, nuts, and seeds also increased between 2006 ($79.73), 2010 ($88.92), and 2014 ($92.10).
This was an 11.5% increase between 2006 and 2010, and a further 3.6% increase between 2010 and 2014.
Grains
Grain foods which included bread, cereals, rice, noodles, canned spaghetti, flour, and crackers in the original HFAB, increased from $101.68 in 2006 to $137.40 in 2010 (35.1% increase), and then decreased by 6.8% to $128.05 in 2014.
Dairy
The milk, yoghurt, and cheese food group was $58.27 in 2006, $70.26 in 2010 (20.6% increase) and $67.25 in 2014 (4.3% decrease from 2010).
Figure 20: Average cost of original Healthy Food Access Basket by healthy food groups in 2006, 2010 and 2014
Source: Healthy Food Access Basket Survey 2014, Queensland Government Statistician's Office, Queensland Treasury and Trade.
© The State of Queensland (Queensland Treasury and Trade) (2014). Creative Commons: BY. This figure is suitable for Open Data.
Brisbane
The CPI for food is based on a wide range of commonly purchased items including healthy and less healthy foods. CPI data is available for capital cities only.
In the time between the HFAB survey in 2010 and the survey in 2014, the CPI for food in Brisbane increased by 1.6%. Fruit and vegetables increased in that time by 3.2% which is higher than the CPI increases for snacks and confectionary (1.3%), water, soft drinks and juices (1.9%) and takeaway and fast-foods (2.7%).
Table 5: Annual percentage change for the Consumer Price Index for selected food groups (XSLX, 15KB) shows data for June Quarter 1997 to June Quarter 2014 in Brisbane.