Cost of following the Australian Guide to Healthy Eating for a 6 person household in 2014
The 2014 Healthy Food Access Basket (HFAB) contains 49 healthy food items, while the basket used in previous surveys contained 44 food items. The 2014 HFAB is aligned with the Australian Guide to Healthy Eating, while the original basket included a number of less healthy choices (including sugar, sausages, and canned meats).
- Difference between 2014 basket and original basket
- Generic (non-branded) food products
- Fruit
- Vegetables and legumes
- Grain foods
- Lean meats, poultry, fish, eggs, nuts, and seeds
- Milk, yoghurt, and cheese
Difference between 2014 basket and original basket
- 2014 basket contains 49 healthy items, particularly fresh produce and minimal processed items
- Original basket contains 44 items including processed items and less healthy choices (e.g. sausages, canned meats, sugar)
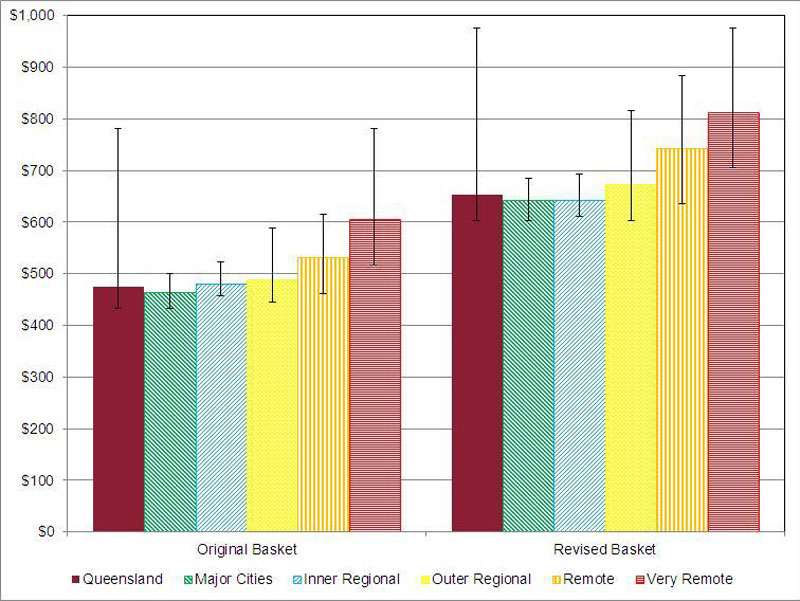
- Average cost of original basket was $475.56
- Average cost of 2014 basket was $652.10
- 2014 basket was 37.1% ($176.54) more costly in Queensland
- Largest difference in remote areas at $210.72 (39.6%)
- Smallest difference in inner regional areas at $161.70 (33.6%)
Table 3: Cost of original basket and basic food groups in 2014 - average and range (XLSX, 14KB)
Table 4: Cost of 2014 basket and basic food groups in 2014 - average and range (XLSX, 14KB)
Figure 17: Cost of original and 2014 Healthy Food Access Basket in 2014 - average and range
Source: Healthy Food Access Basket Survey 2014, Queensland Government Statistician's Office, Queensland Treasury and Trade.
© The State of Queensland (Queensland Treasury and Trade) (2014). Creative Commons: BY. This figure is suitable for Open Data.
Generic (non-branded) food products
- 2014 generic (cheapest) basket was 47.9% ($174.37) more costly than original generic basket in Queensland.
- Largest difference in major cities at 49.7% higher.
- Smallest difference in very remote areas at 39.1% higher.
Fruit
- Average cost was 45.8% ($28.34) higher in 2014 basket compared to original basket.
- Largest difference in inner regional areas at 49.9% higher.
- Smallest difference in very remote areas at 41.9% higher.
- 2014 basket contains more fresh apples and bananas and less juice than the original basket.
Vegetables and legumes
- Average cost was 55.5% ($59.58) higher in 2014 basket compared to original basket.
- Largest difference in remote areas at 62.3% higher.
- Smallest difference in outer regional areas at 53.8% higher.
- 2014 basket contains 20 vegetable varieties versus 11 in the original basket.
Grain foods
- Average cost was 39.5% ($50.61) lower in 2014 basket compared to original basket.
- Largest difference in very remote areas at 41.7% lower.
- Smallest difference in inner regional areas at 38.6% lower.
- 2014 basket contains fewer grain foods than the original basket.
Lean meats, poultry, fish, eggs, nuts, and seeds
- Average cost was 102.0% ($93.90) higher in 2014 basket compared to original basket.
- Largest difference in outer regional areas at 110.1% higher.
- Smallest difference in inner regional areas at 84.5% higher.
- Canned meats were removed from the 2014 basket and replaced with more fresh products.
Milk, yoghurt, and cheese
- Average cost was 81.5% ($54.77) higher in 2014 basket compared to original basket.
- Largest difference in major cities at 85.7% higher.
- Smallest difference in very remote areas at 65.0% higher.
- Powdered and long-life milk were removed from the 2014 basket and replaced with fresh milk and yoghurt.