2014 Healthy Food Access Basket Survey
The Healthy Food Access Basket (HFAB) survey measures the cost and availability of a standard basket of healthy food items in Queensland.
The cost of food is a primary driver of purchasing decisions. Having access to healthy food options which are affordable and convenient choices for all Queenslanders is critical for health and wellbeing.
- Basket contents
- Surveyed locations
- Selected grocery stores
- Survey method
- Households
- Previous HFAB surveys
- Contact for more information
Basket contents
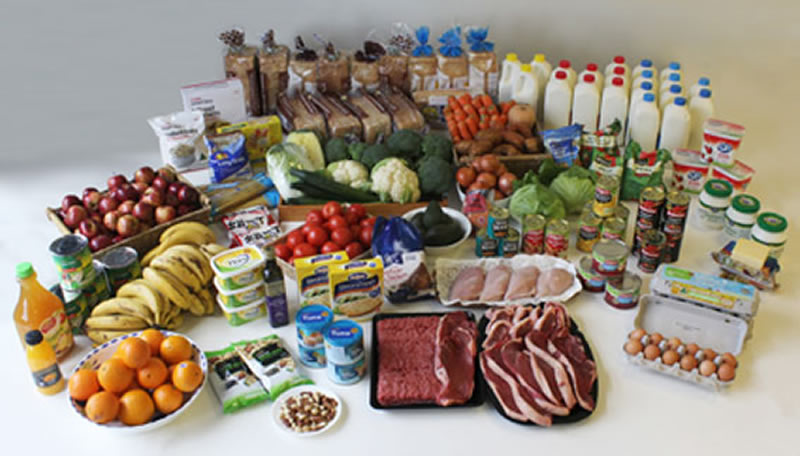
The food in the basket is based on the recommended food groups in the Australian Guide to Healthy Eating. The 49 food and drinks included meet the nutritional needs for each household for a 2 week period.
The food basket was changed for the 2014 survey and includes a greater range of fresh foods and less packaged foods than the basket used in 2000, 2001, 2004, 2006, and 2010 (the original HFAB).
Table 1: Foods and quantities in Healthy Food Access Basket (DOCX, 803KB)
Figure 1: Photo of foods in Healthy Food Access Basket
Surveyed locations
Seventy-eight towns were surveyed in 2014:
- 10 major cities
- 10 inner regional
- 18 outer regional
- 18 remote and
- 22 very remote towns.
These towns were also surveyed in 2006 and 2010.
The Australian Bureau of Statistics Urban Centre/ Locality list was used to obtain a distribution of towns with a population of more than 200 people. The towns were then stratified using the ABS Accessibility/Remoteness Index of Australia (ARIA+) (major cities, inner regional, outer regional, remote and very remote). There was over-sampling in remote and very remote areas. Towns were then randomly selected to be included in the sample.
Figure 2: Location and ABS remoteness classifications for the 78 stores in the 2014 Healthy Food Access Basket Survey
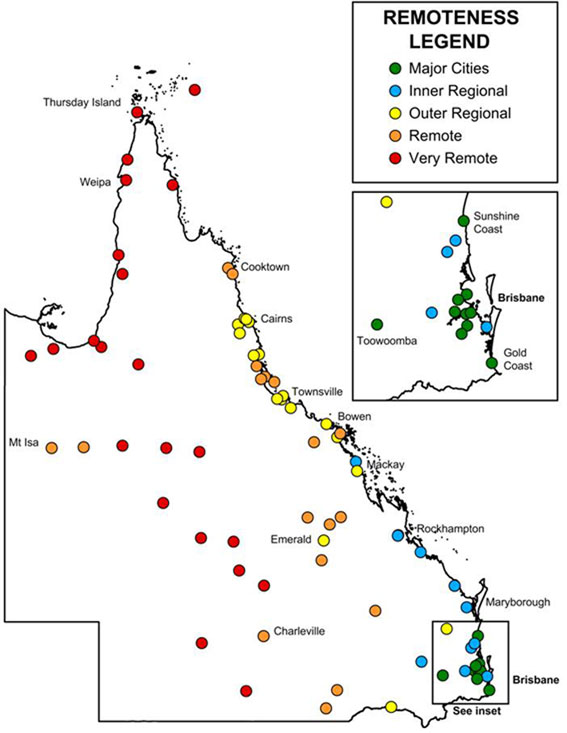
Healthy Food Access Basket Survey 2014, Queensland Government Statistician's Office, Queensland Treasury and Trade.
© The State of Queensland (Queensland Treasury and Trade) (2014). Creative Commons: BY. This figure is suitable for Open Data.
Selected grocery stores
One grocery store for each town was then selected based on where most people would be likely to shop. This was assumed to be either a Woolworths™ or Coles™ supermarket as these are the 2 largest grocery store chains in Queensland.
For towns without 1 of these supermarkets, the largest store was surveyed. Generally, the stores chosen for the 2014 survey were the same as those in the 2010 survey.
Due to store closures, in some locations new stores were selected.
Survey method
Queensland Government Statistician’s Office fieldworkers visited the 78 stores between 12 and 30 May 2014. Using hand-held electronic devices, food item prices, and quality and availability of selected fruit and vegetable items were recorded. The price information was collected under the Statistical Returns Act 1896 (PDF, 278KB), which prohibits the disclosure of identifiable information relating to a person (including a business) without their consent.
Price data
The price data collected was for the prices of the cheapest brand item and the cheapest generic item available for the 63 HFAB food items (30 for both the original and 2014 HFAB, 14 for the original HFAB, and 19 for the 2014 HFAB). The price for 5 unhealthy food items (soft drink, cream-filled biscuits, chocolate, potato crisps and meat pie) and 2 tobacco items was also collected.
The data were analysed using Statistical Analysis System (SAS) and the results are presented in figures and tables of the averages and ranges for the minimum and maximum basket cost.
Cost calculation
To calculate the cheapest HFAB cost, the recorded generic price was used, or the recorded brand price if a generic product was not available. For missing items, the mean cost for that item across other stores from the same remoteness category was used as the default cost in the HFAB.
Results were calculated for the original HFAB and the 2014 HFAB as well as comparisons between the original and 2014 baskets.
Results were further classified based on the ARIA+, with the basket costs averaged over all stores in each region (major cities, inner regional, outer regional, remote and very remote). The averages for Queensland are proportional to the counts for each household type and remoteness classification.
Households
The original HFAB was calculated based on the 6 person household only, consistent with previous HFAB surveys. The 2014 HFAB was calculated for 5 households which are common in Queensland:
- 1 person household – single male
- 2 person household – older couple with no children
- 3 person household – single mother with 2 children
- 4 person household – couple with 2 children
- 6 person household – couple with 3 children and grandmother.
Assumed income
The Australian Government Department of Human Services provides financial payments to job seekers and families to assist them in meeting living expenses. This is considered to be the minimum income on which people in Queensland communities live and was used as a comparison point for the affordability of the HFAB.
The Queensland Council of Social Services Cost of Living assumptions were adapted and fortnightly income as at 1 April 2014 from a combination of paid employment and Government support was calculated for each household.
Table 2: Household structures and assumed income (XLSX, 14KB)
Previous HFAB surveys
- 2010 (PDF, 875 KB)
- 2006 (PDF, 399 KB)
- 2004 (PDF, 432 KB)
- 2001 (PDF, 227 KB)
- 2000 (PDF, 315 KB) and Summary (PDF, 207 KB)
Hard copies of these reports are no longer available from Queensland Health.
Contact
Prevention Division, Department of Health