Acute respiratory infection surveillance reporting
Number of persons hospitalised with COVID-19, Influenza, RSV in Queensland
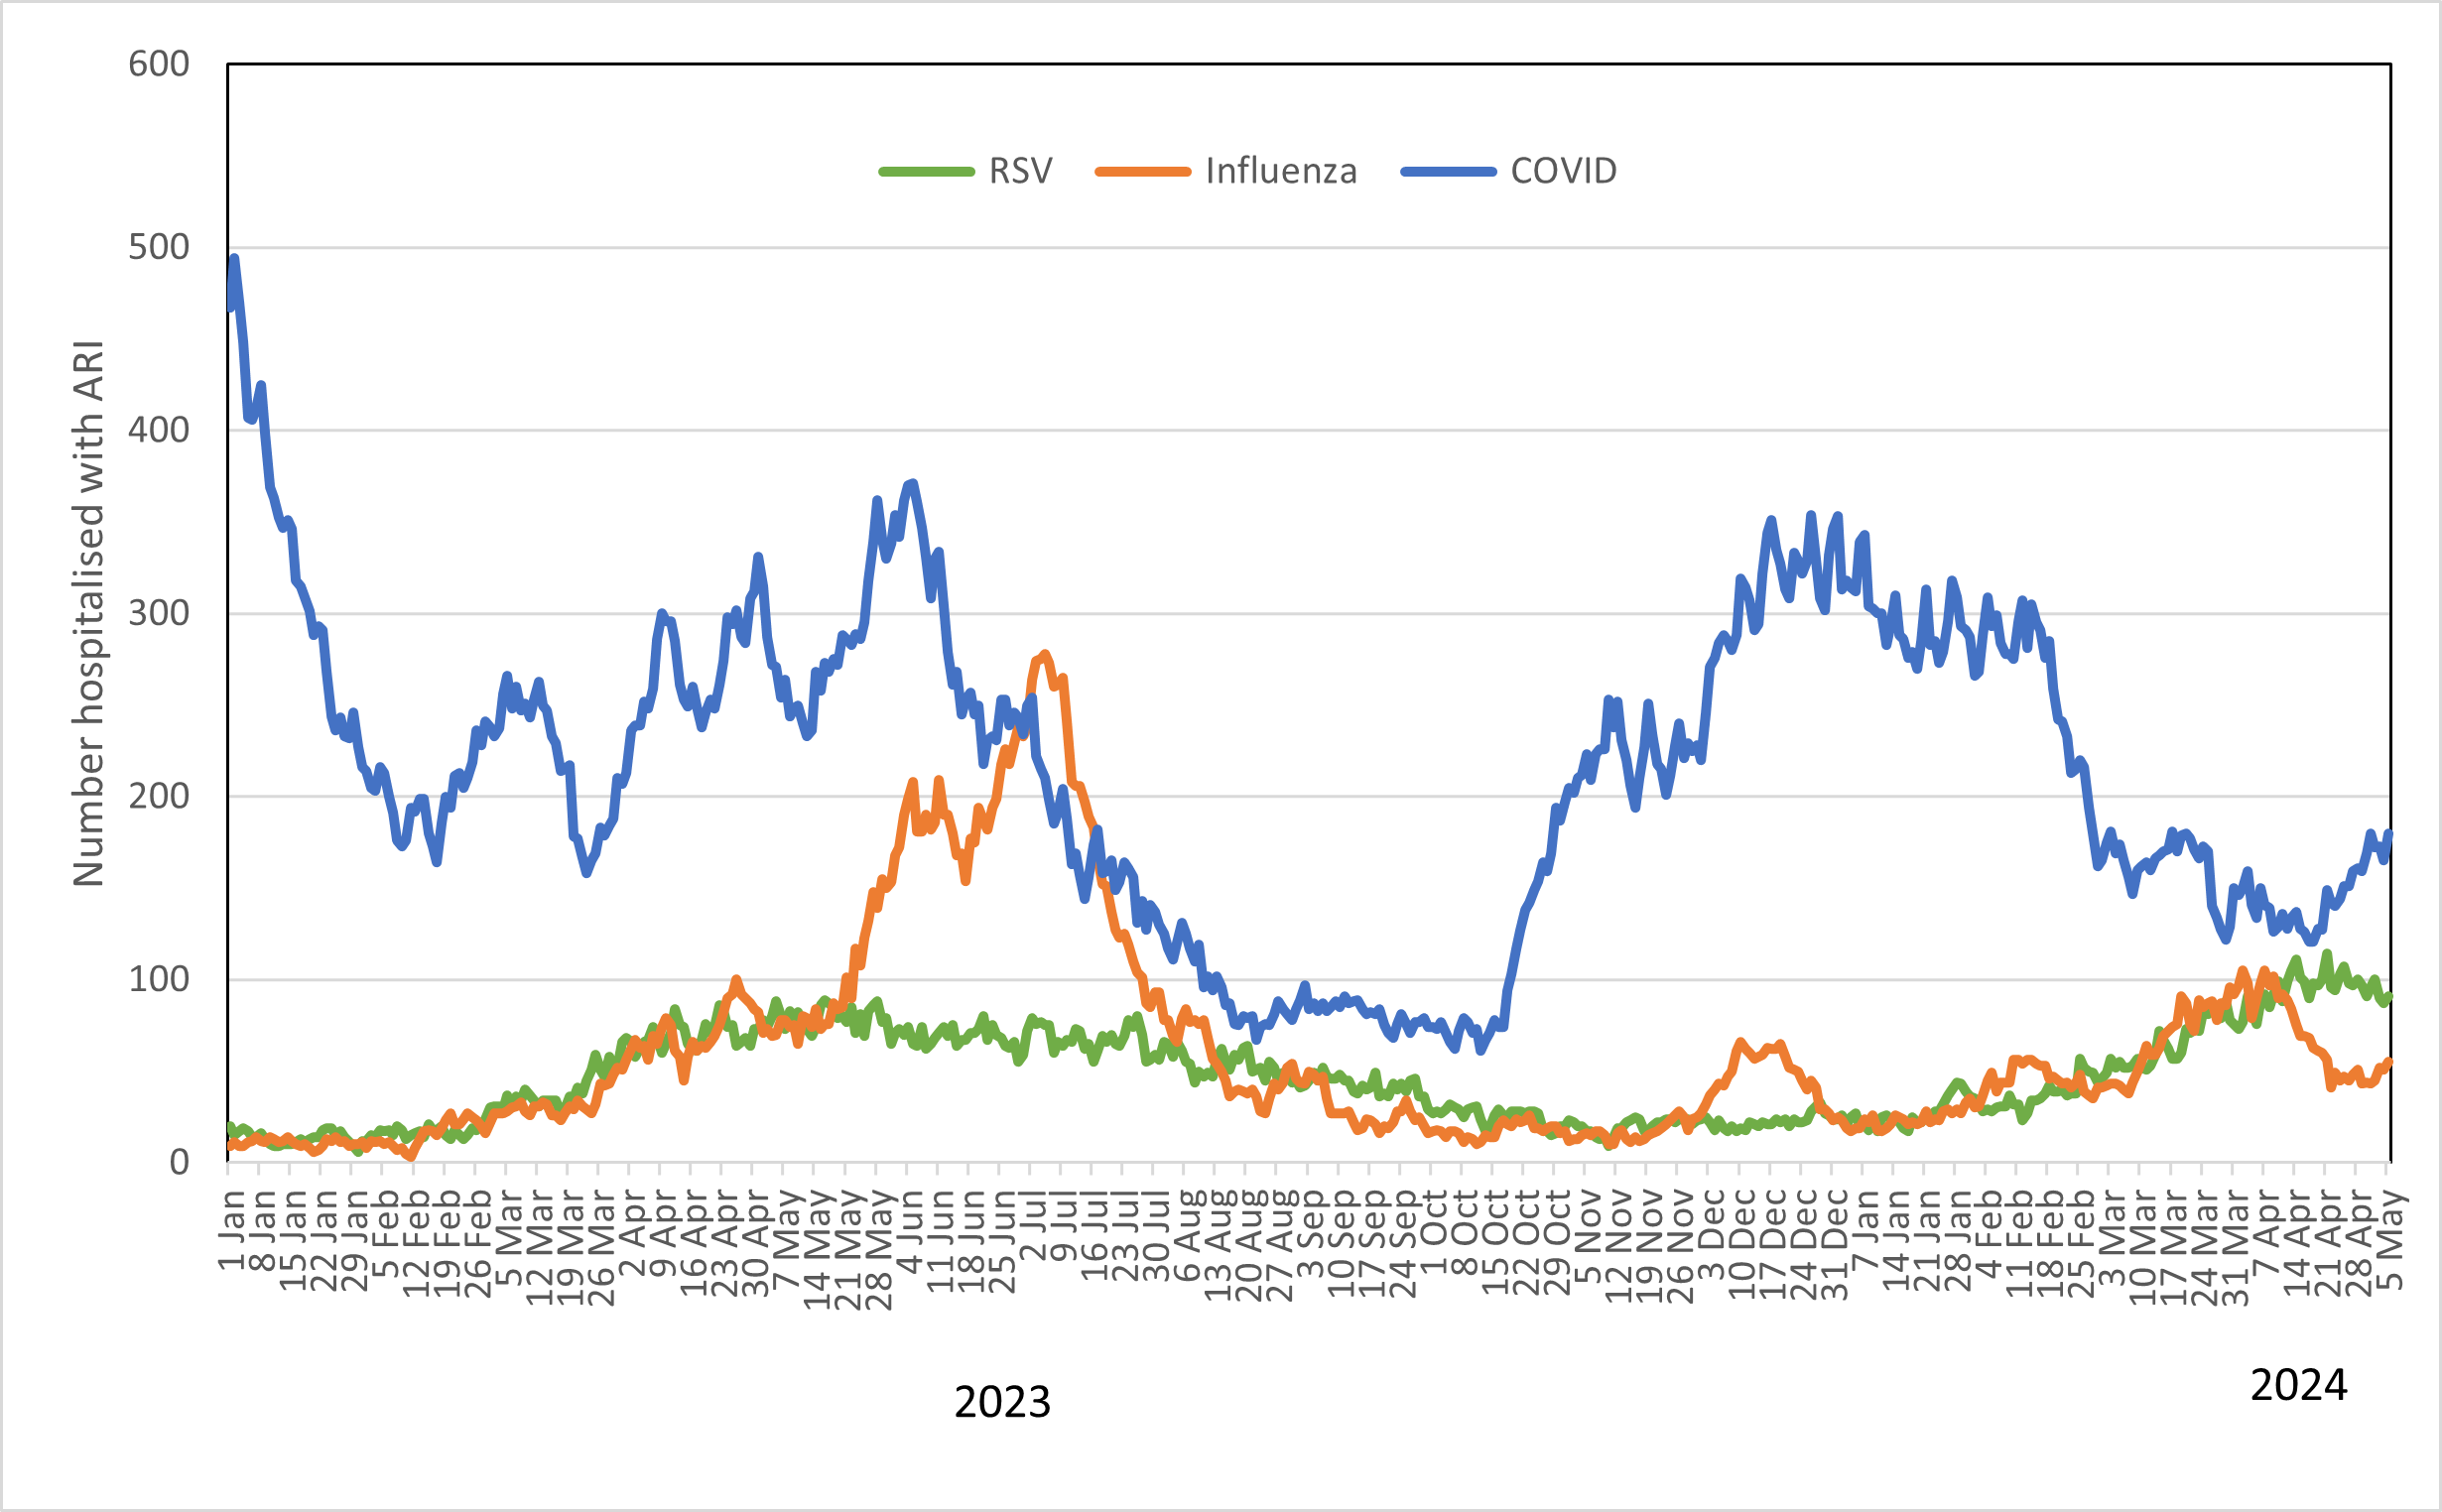
Number of persons hospitalised with COVID-19, Influenza or RSV in Queensland since 1 January 2023
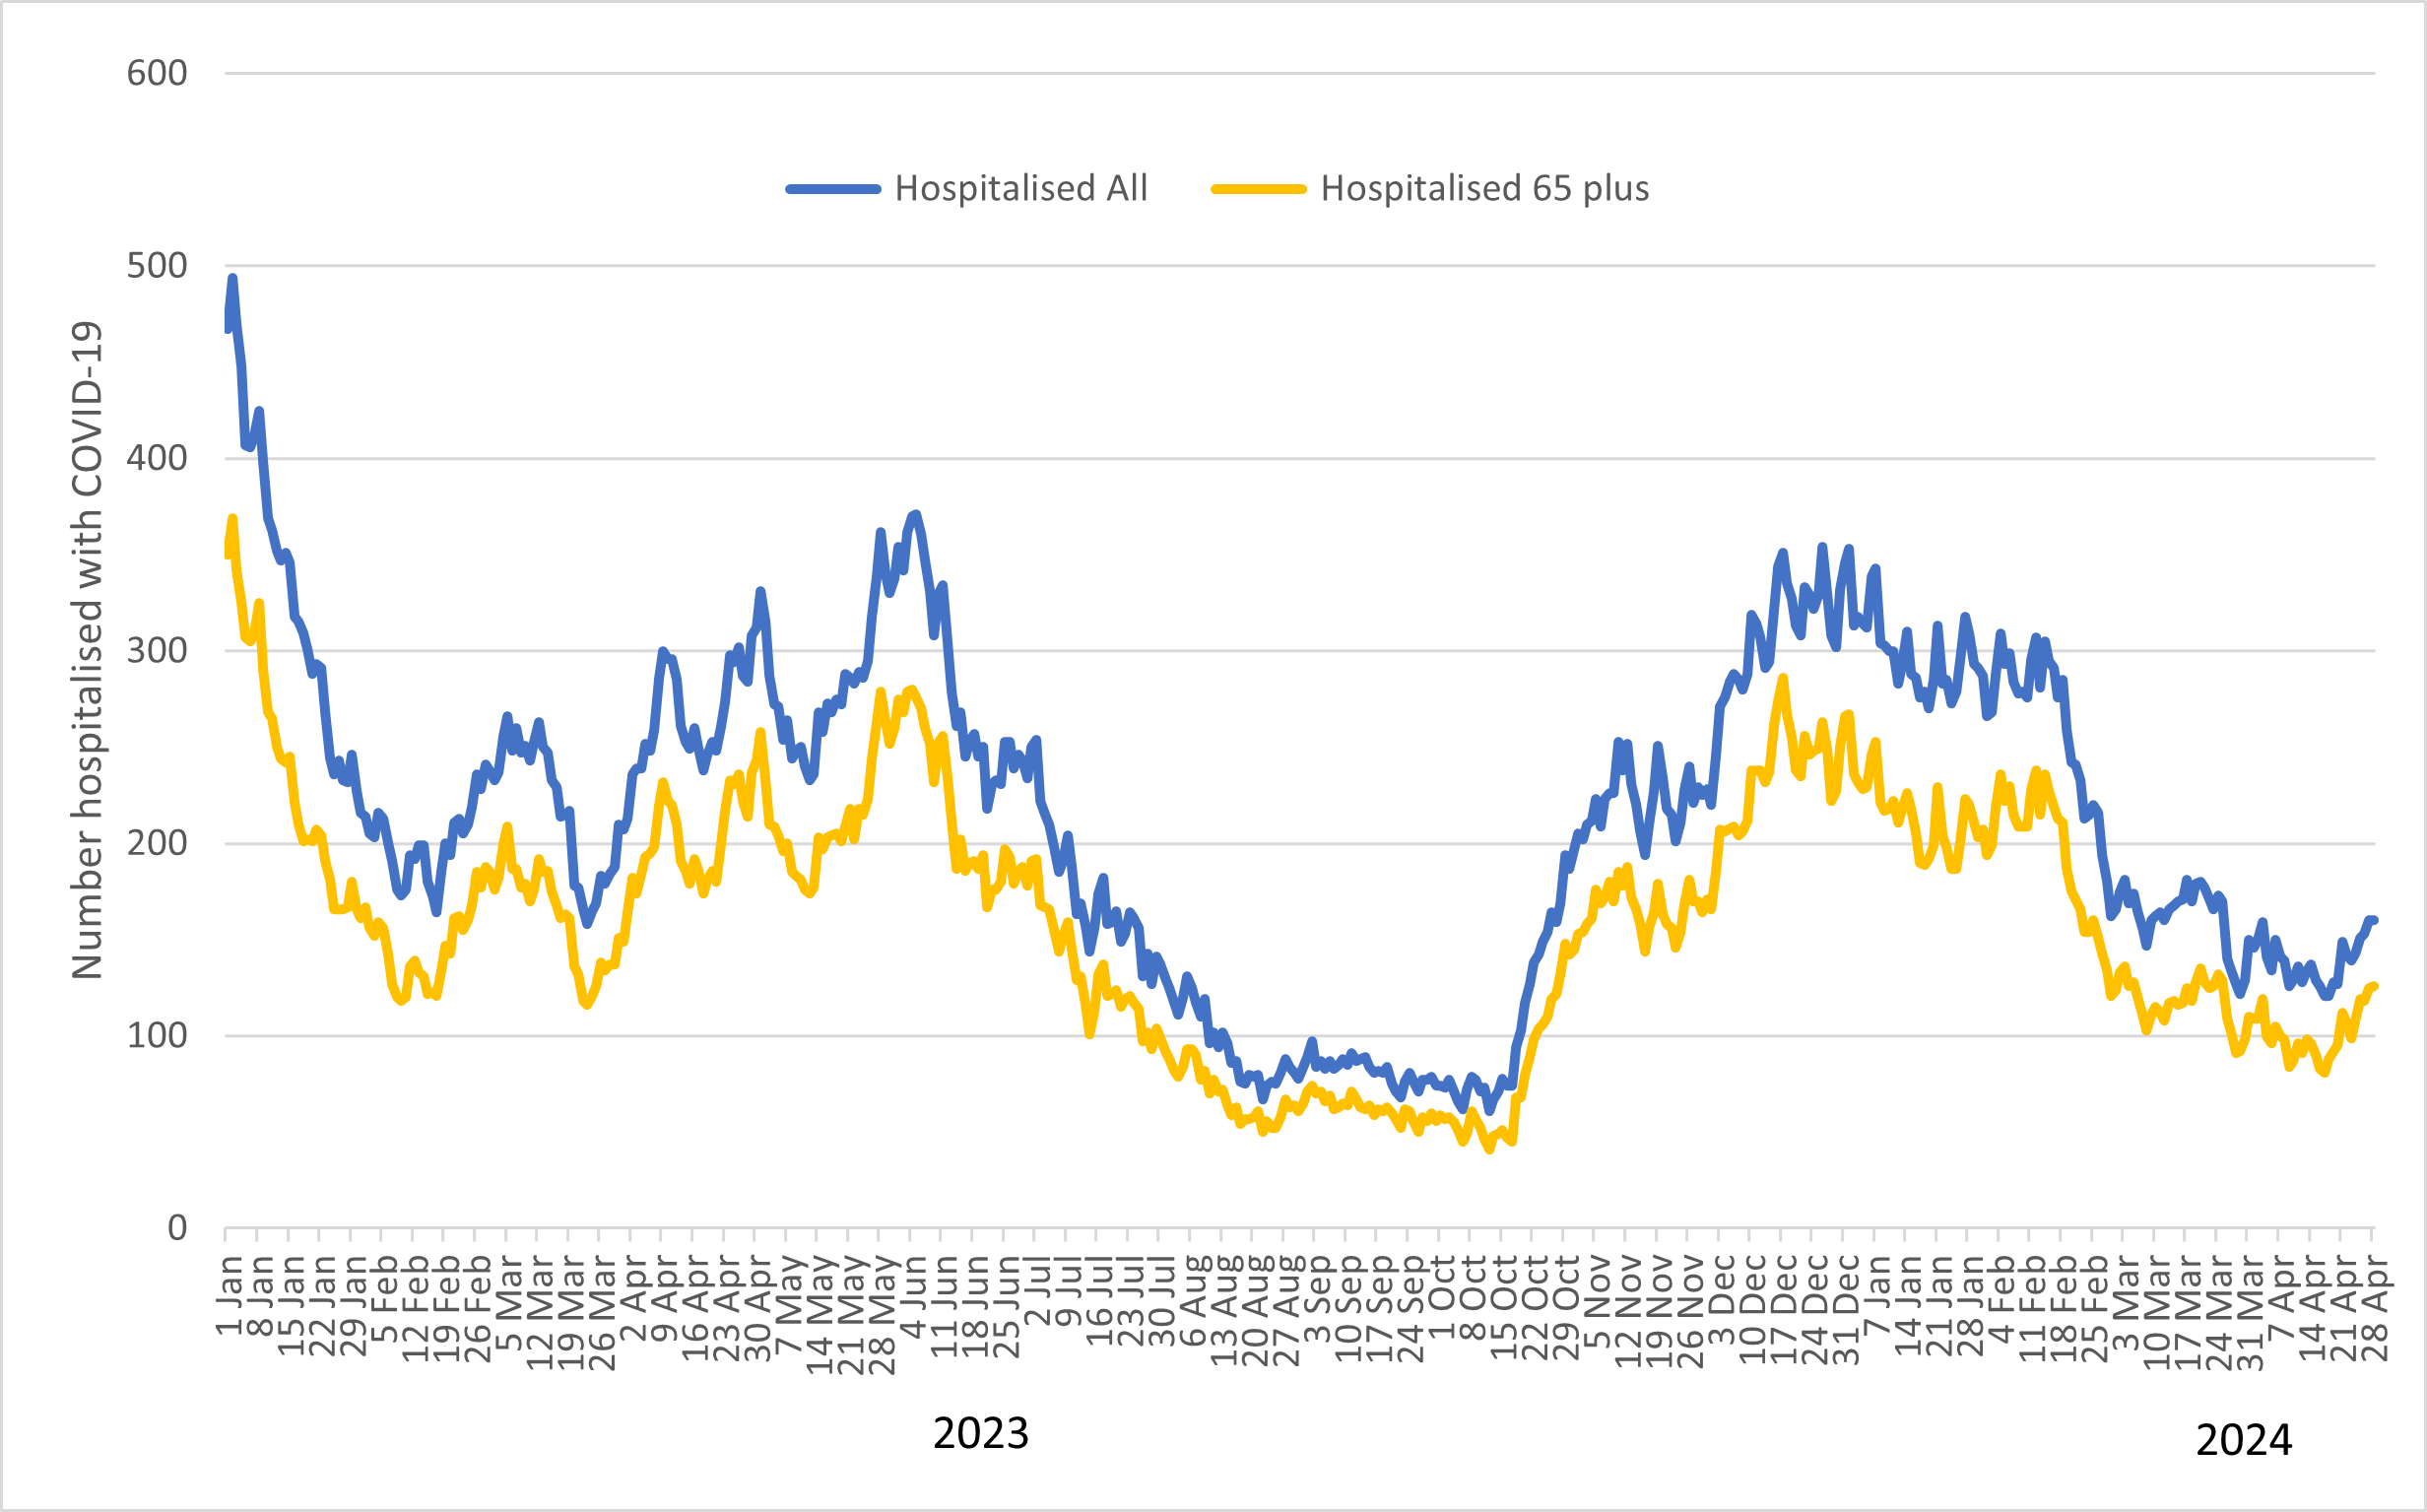
Number of persons hospitalised with COVID-19 in Queensland since 1 January 2023
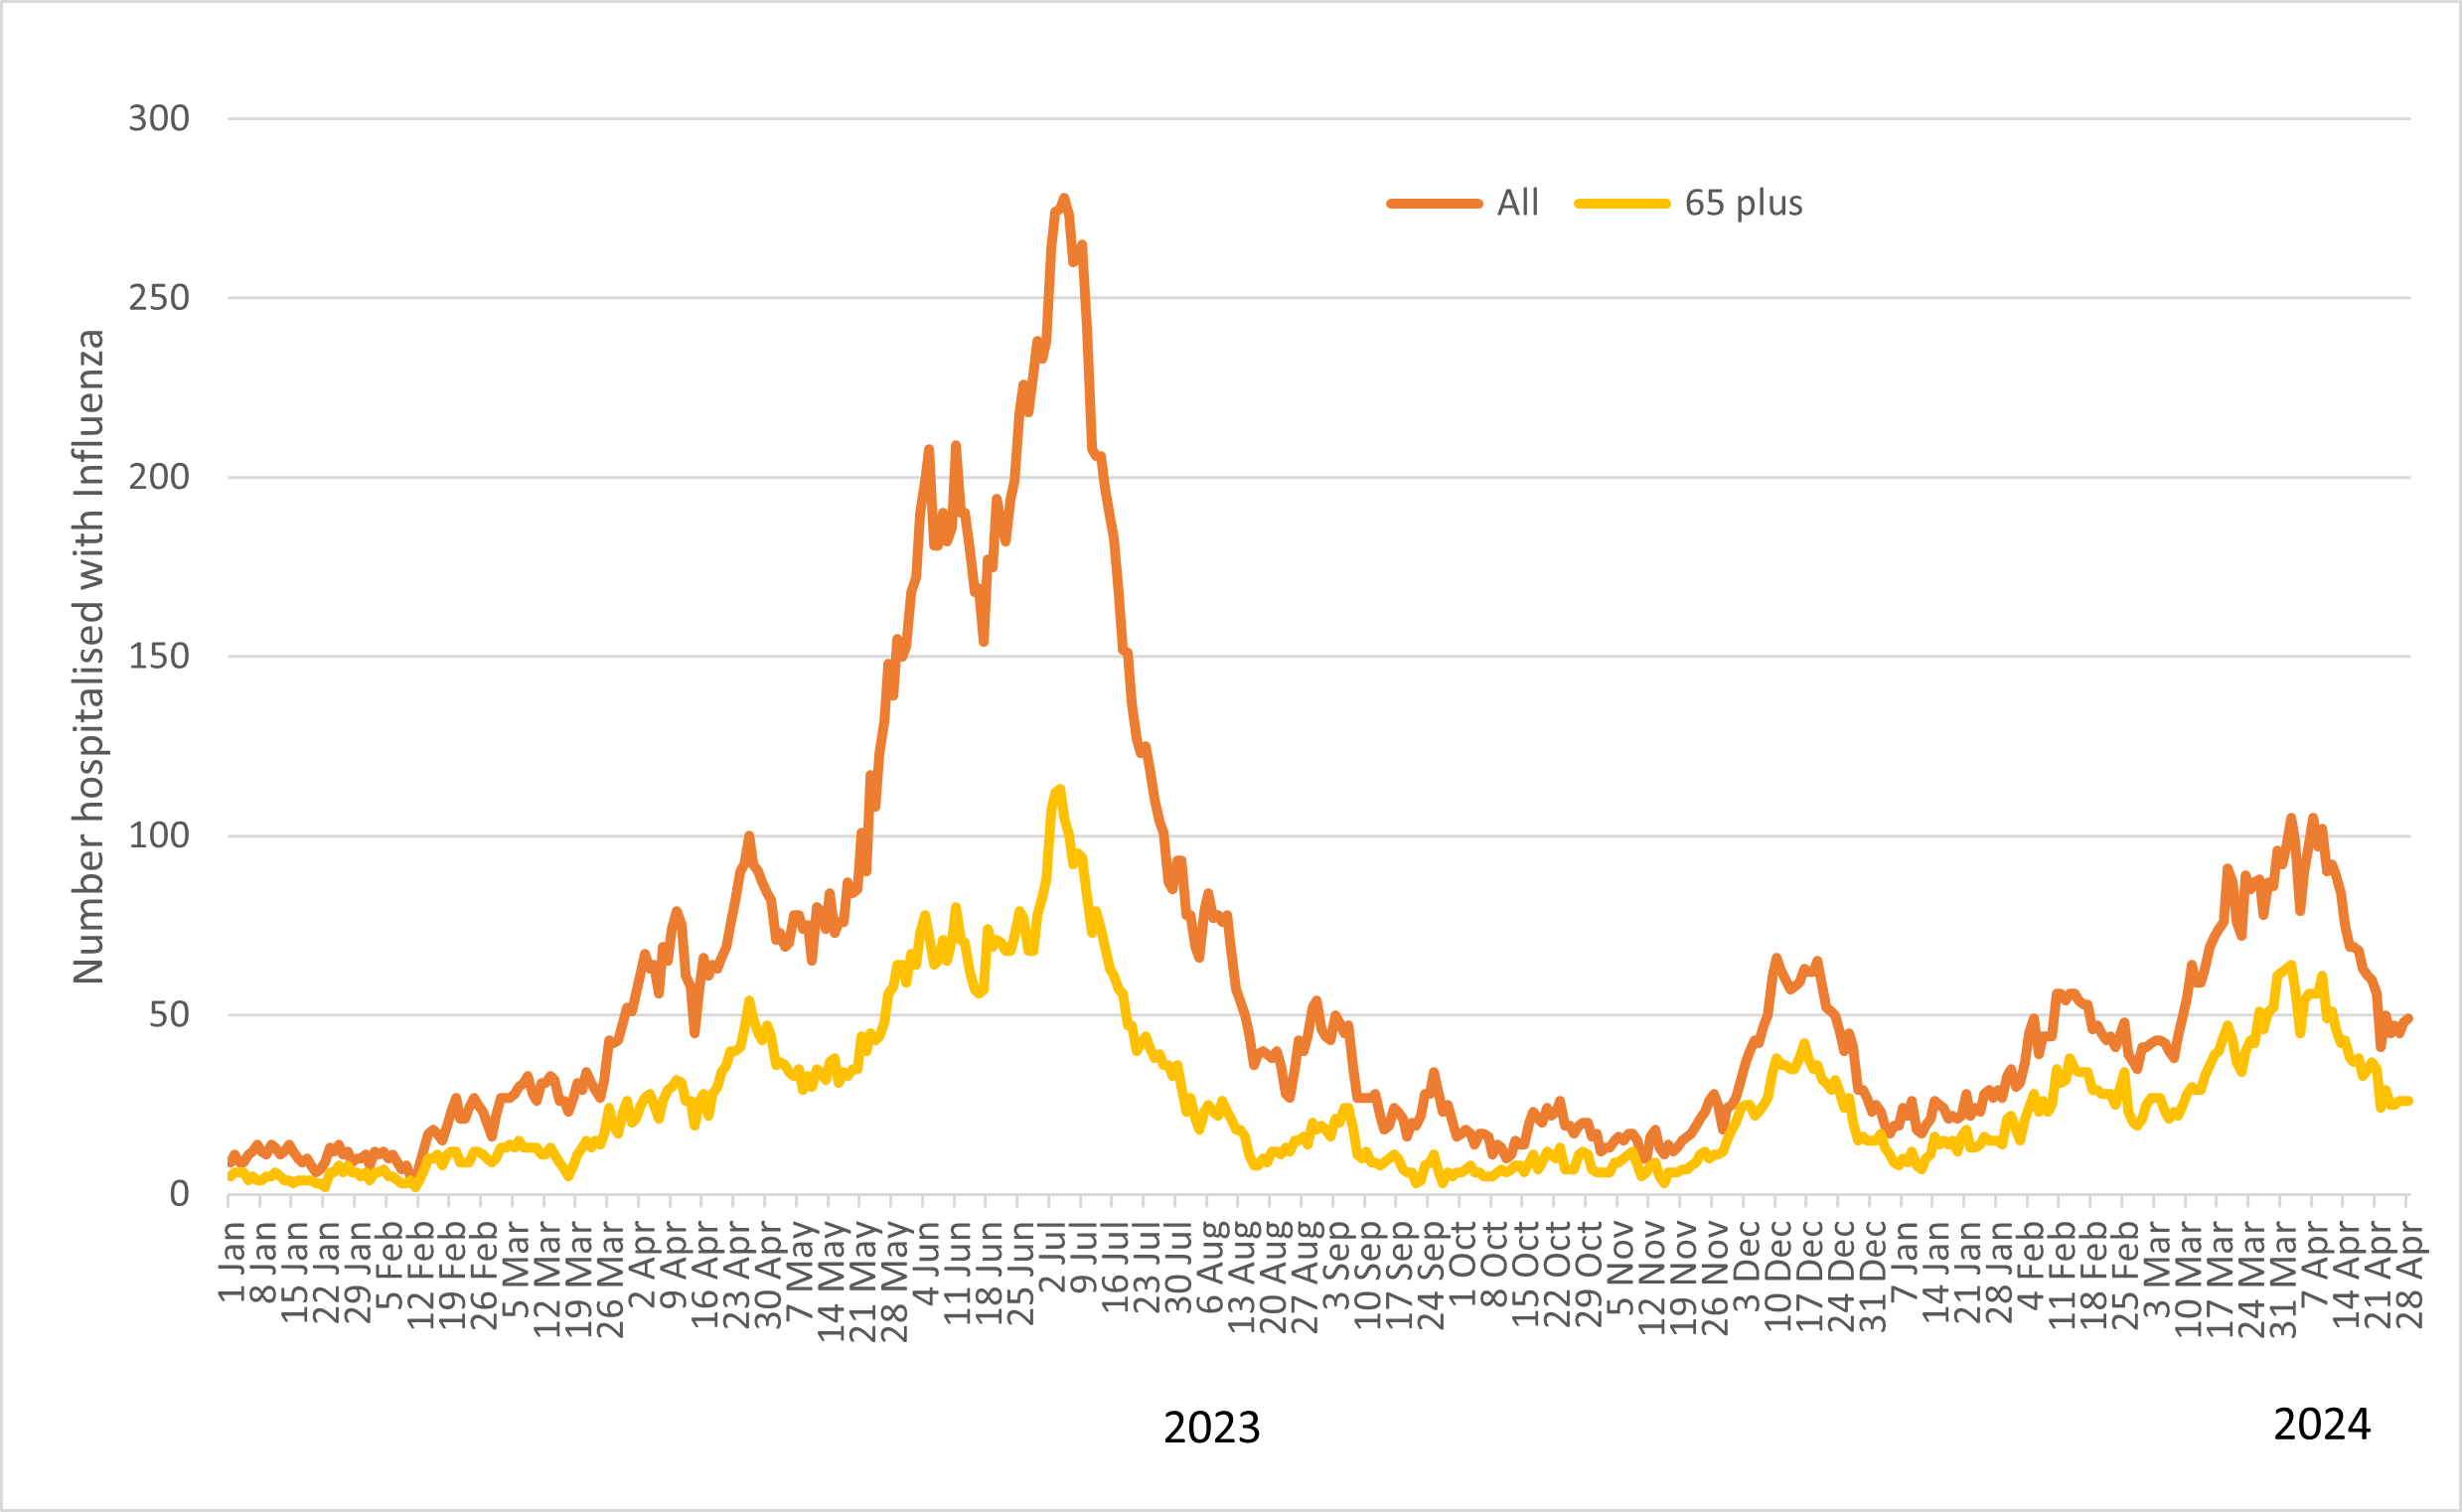
Number of persons hospitalised with Influenza in Queensland since 1 January 2023
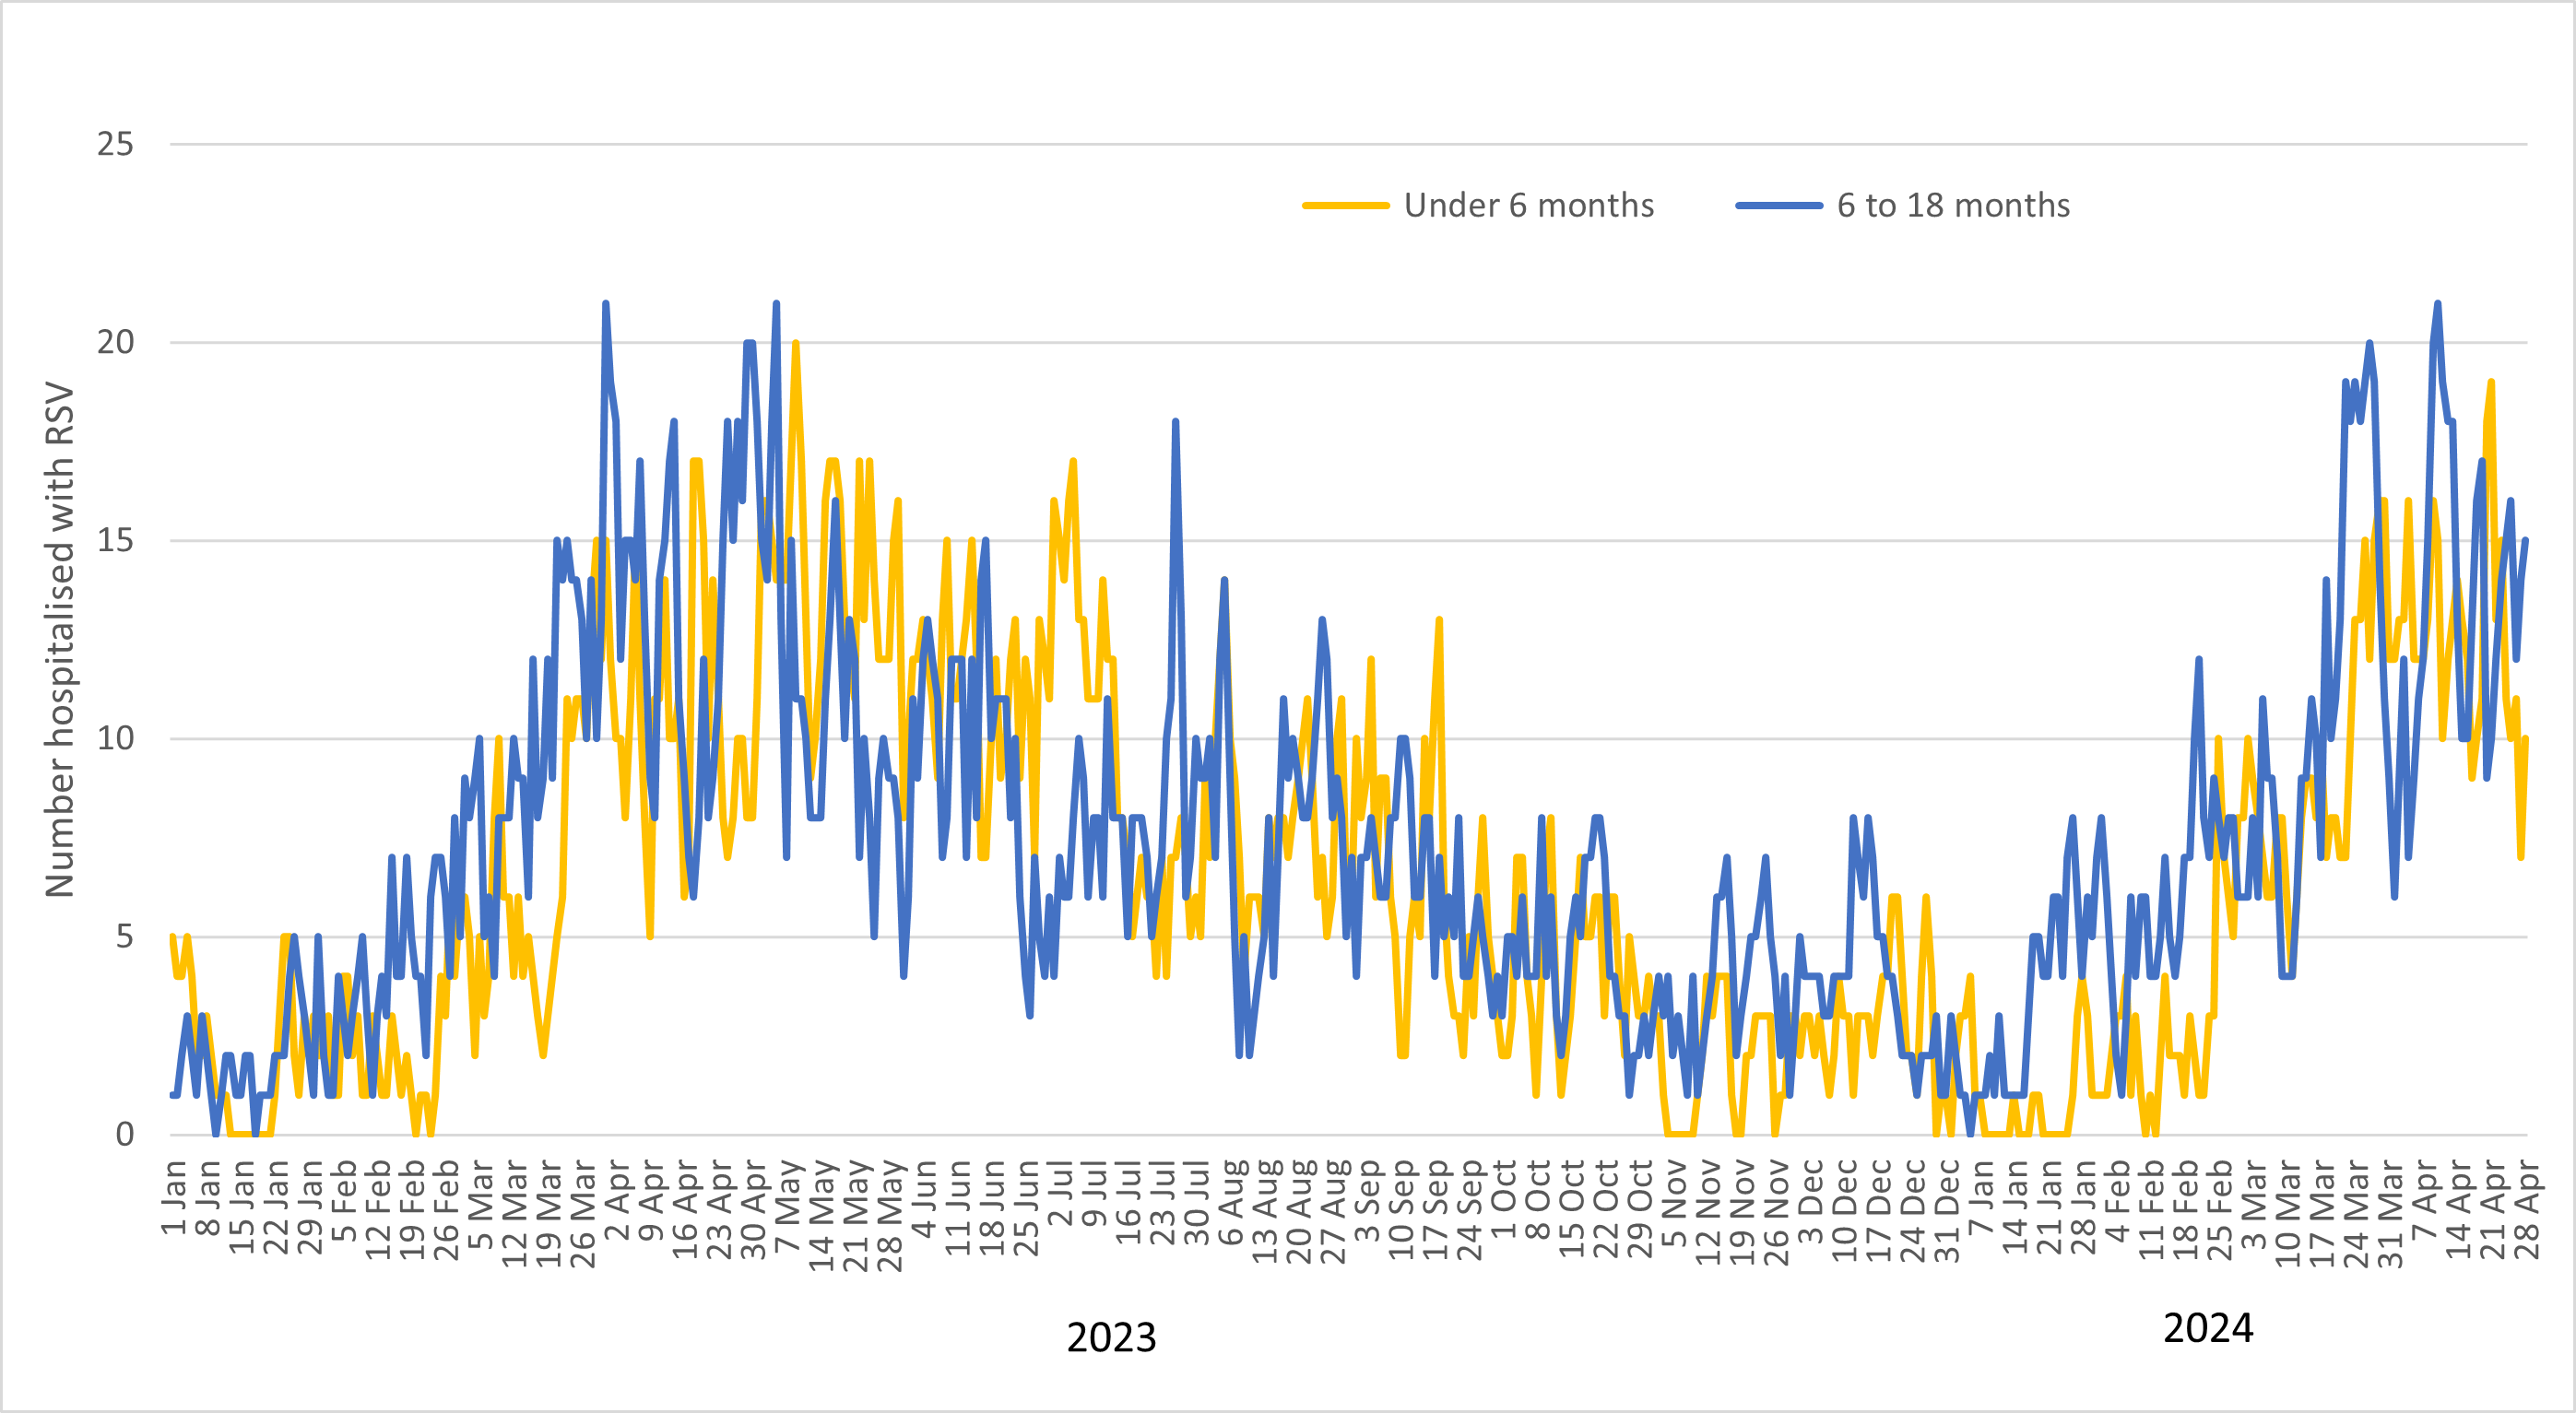
Number of persons hospitalised with RSV in Queensland since 1 January 2023
Number of First Nations persons hospitalised with COVID-19, Influenza or RSV in Queensland since 1 January 2023
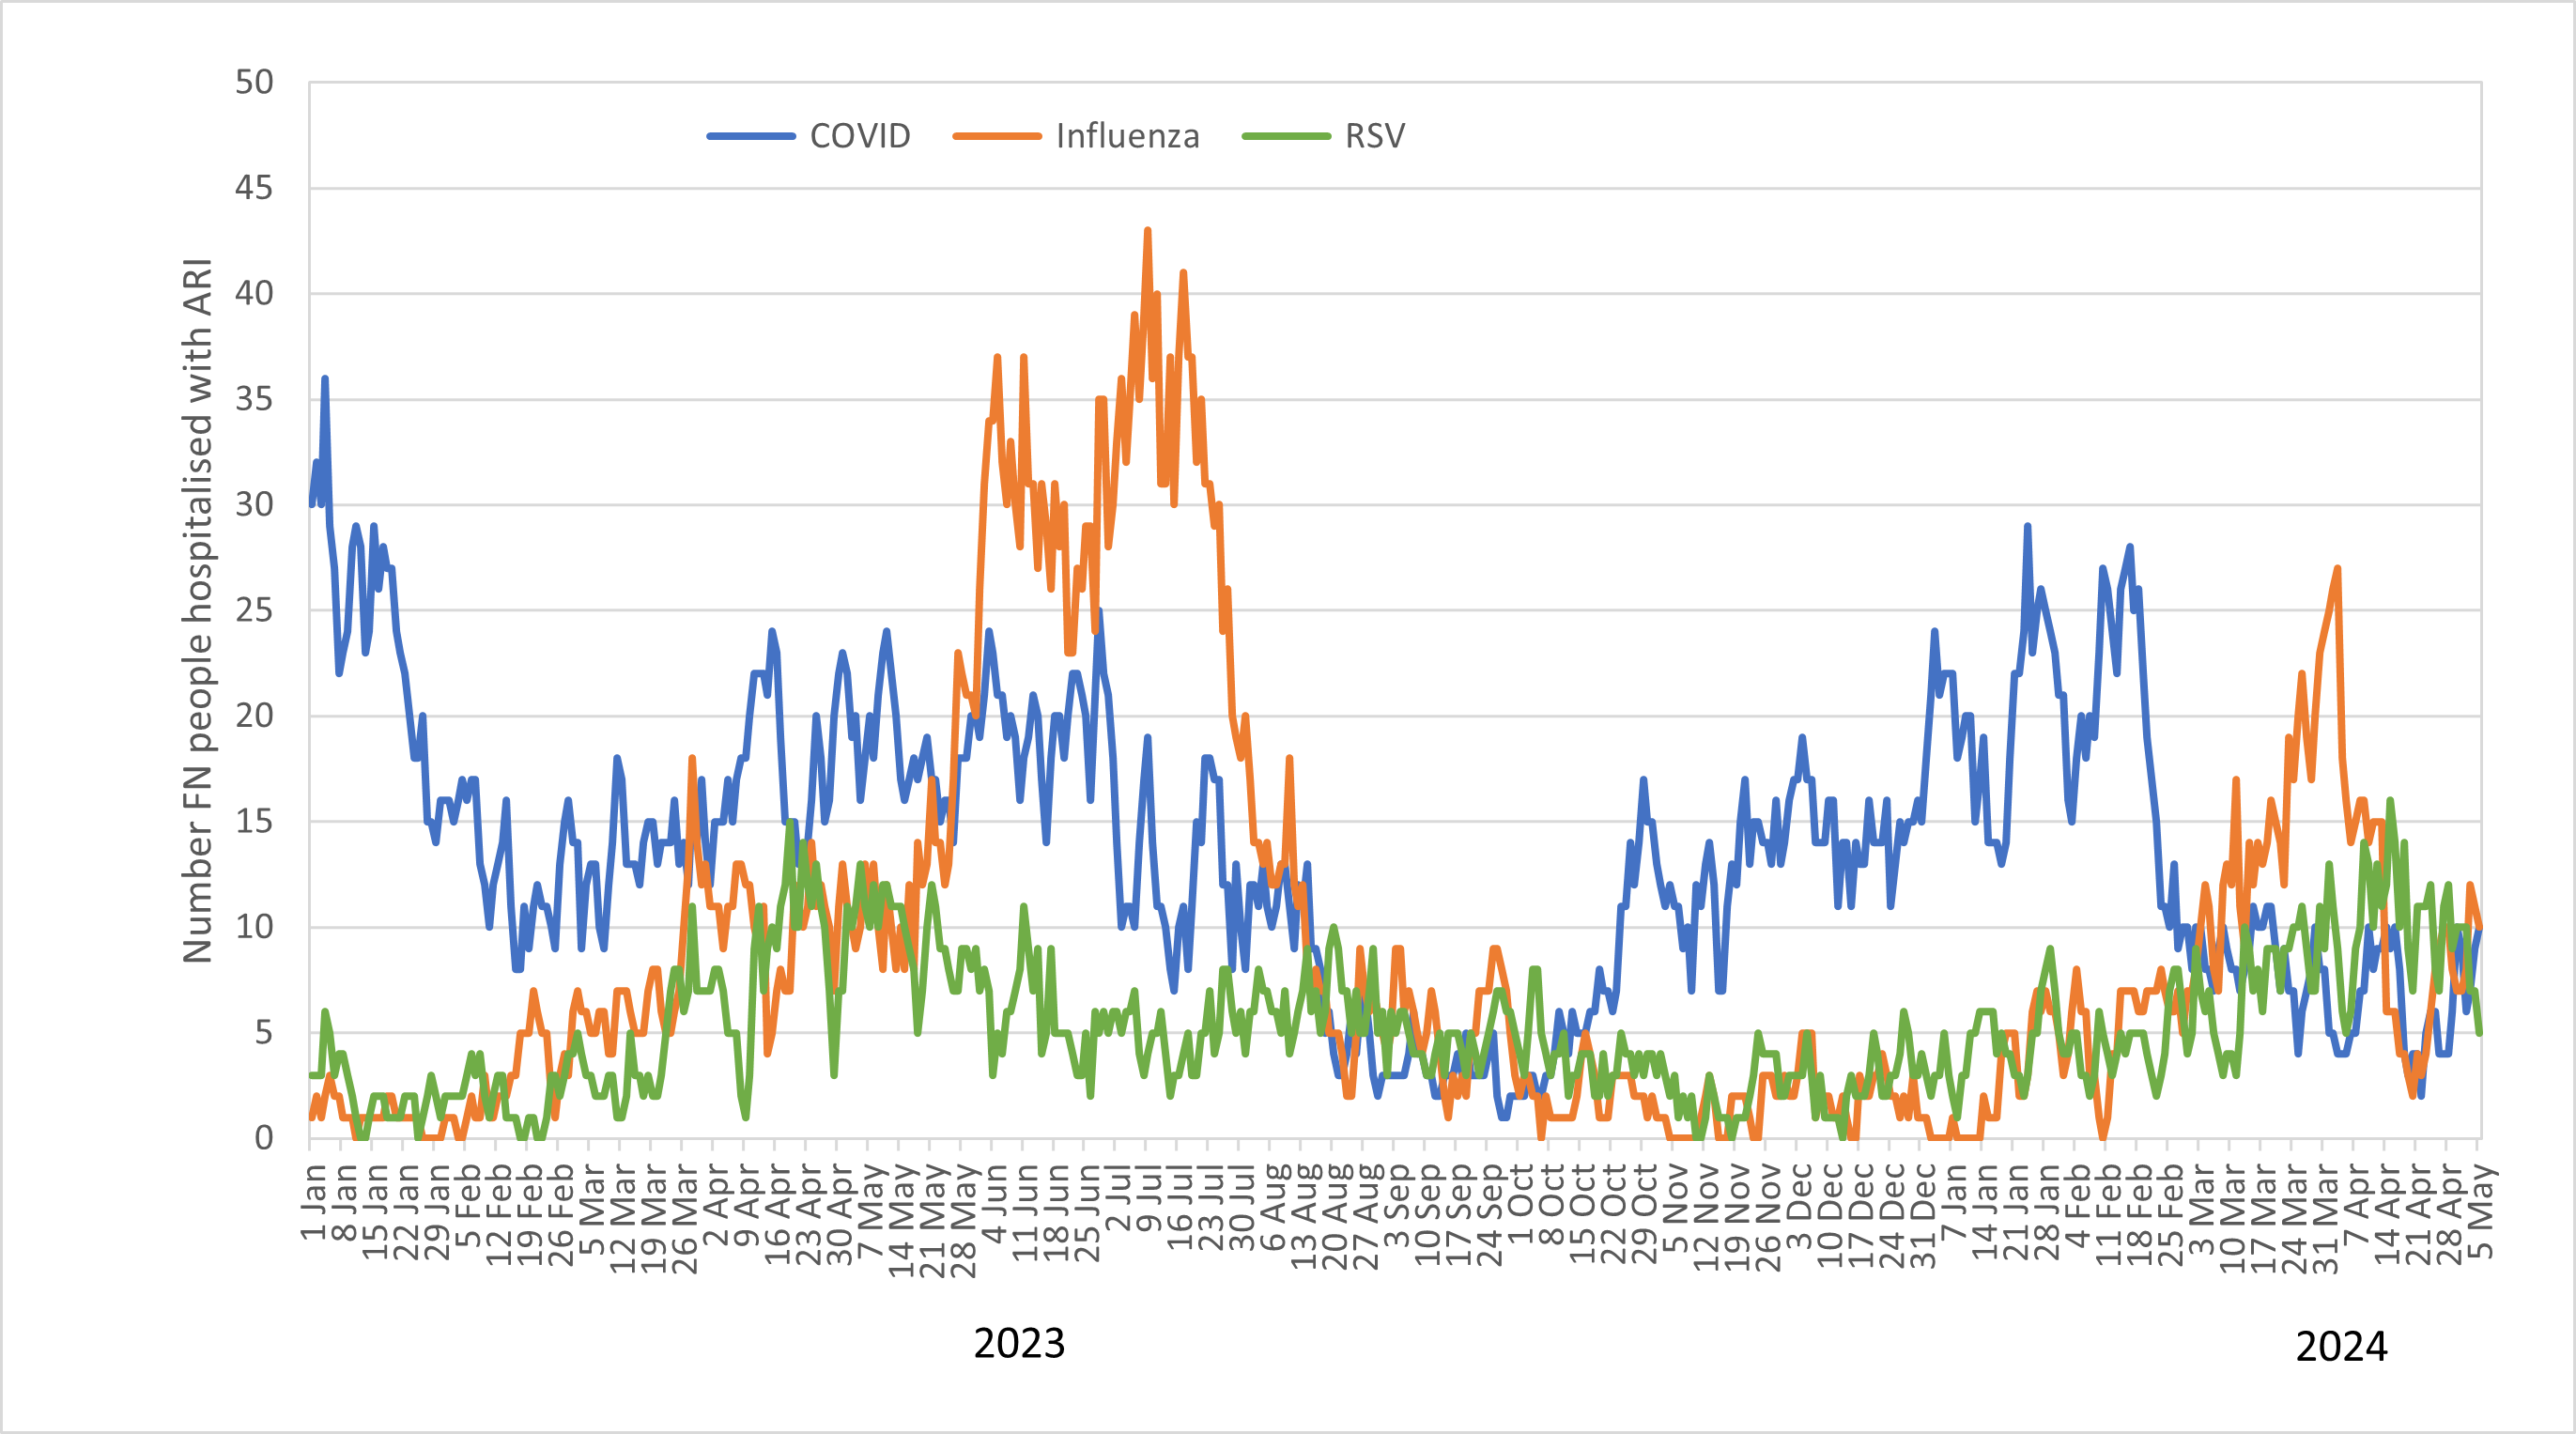
Data extracted on 22 April 2024
COVID-19
145 people were in hospital with COVID-19, 30 (21%) were aged 65–74 years and 80 (55%) were 75 years or more.
821 people diagnosed in the last week, 114 (14%) were aged 65–74 years and 205 (25%) were 75 years or more.
ATAGI recommends people aged 75 years and older get a booster dose every 6 months.
Influenza
57 people were in hospital with Influenza, most (63%) were aged 65 years or more.
662 people diagnosed in the last week, 129 (19%) were aged 65 years or more.
Respiratory Syncytial Virus (RSV)
80 people were in hospital with RSV, 12 (15%) were aged under 6 months and 9 (11%) were between 6 months to less than to 2 years.
1336 people diagnosed in the last week, 93 (7%) were aged under 6 months and 322 (24%) were between 6 months to under 2 years.
Number of persons hospitalised
Number of persons in hospital with COVID-19 by age group and HHS of residence – snapshot on 21 April 2024
HHS | All | under 5 | 5 to 17 | 18 to 64 | 65 to 74 | 75 plus |
|---|---|---|---|---|---|---|
| Torres and Cape | 0 | 0 | 0 | 0 | 0 | 0 |
| Cairns and Hinterland | 4 | 0 | 0 | 1 | 1 | 2 |
| North West | 0 | 0 | 0 | 0 | 0 | 0 |
| Townsville | 14 | 0 | 0 | 2 | 0 | 12 |
| Mackay | 5 | 0 | 0 | 0 | 3 | 2 |
| Central Queensland | 5 | 0 | 0 | 0 | 2 | 3 |
| Central West | 0 | 0 | 0 | 0 | 0 | 0 |
| Wide Bay | 21 | 0 | 0 | 4 | 5 | 12 |
| Sunshine Coast | 8 | 0 | 0 | 1 | 1 | 6 |
| Metro North | 31 | 1 | 1 | 10 | 6 | 13 |
| Metro South | 19 | 1 | 0 | 5 | 4 | 9 |
| Darling Downs | 12 | 0 | 0 | 4 | 1 | 7 |
| West Moreton | 11 | 0 | 0 | 5 | 1 | 5 |
| South West | 3 | 0 | 0 | 0 | 2 | 1 |
| Gold Coast | 12 | 0 | 0 | 0 | 4 | 8 |
| Overseas resident | 0 | 0 | 0 | 0 | 0 | 0 |
| Total | 145 | 2 | 1 | 32 | 30 | 80 |
Number of persons in hospital with influenza by age group and HHS of residence – snapshot on 21 April 2024
HHS | All | under 6m | 6m to 4 yrs | 5 to 17 | 18 to 64 | 65 plus |
|---|---|---|---|---|---|---|
| Torres and Cape | 0 | 0 | 0 | 0 | 0 | 0 |
| Cairns and Hinterland | 6 | 0 | 0 | 0 | 3 | 3 |
| North West | 0 | 0 | 0 | 0 | 0 | 0 |
| Townsville | 7 | 0 | 0 | 0 | 2 | 5 |
| Mackay | 5 | 0 | 0 | 0 | 1 | 4 |
| Central Queensland | 2 | 0 | 0 | 0 | 1 | 1 |
| Central West | 0 | 0 | 0 | 0 | 0 | 0 |
| Wide Bay | 5 | 0 | 0 | 0 | 3 | 2 |
| Sunshine Coast | 2 | 0 | 0 | 0 | 0 | 2 |
| Metro North | 7 | 0 | 0 | 0 | 4 | 3 |
| Metro South | 8 | 0 | 1 | 0 | 3 | 4 |
| Darling Downs | 2 | 0 | 0 | 0 | 2 | 0 |
| West Moreton | 1 | 0 | 0 | 0 | 0 | 1 |
| South West | 0 | 0 | 0 | 0 | 0 | 0 |
| Gold Coast | 11 | 0 | 0 | 0 | 0 | 11 |
| Overseas resident | 1 | 0 | 0 | 0 | 1 | 0 |
| Total | 57 | 0 | 1 | 0 | 20 | 36 |
Number of persons in hospital with RSV by age group and HHS of residence - snapshot on 21 April 2024
HHS | All | under 6m | 6m to 23m | 2 to 4 | 5 to 64 | 65 plus |
|---|---|---|---|---|---|---|
| Torres and Cape | 0 | 0 | 0 | 0 | 0 | 0 |
| Cairns and Hinterland | 4 | 1 | 0 | 1 | 0 | 2 |
| North West | 2 | 0 | 1 | 0 | 0 | 1 |
| Townsville | 5 | 0 | 0 | 0 | 1 | 4 |
| Mackay | 5 | 0 | 0 | 0 | 1 | 4 |
| Central Queensland | 1 | 0 | 0 | 0 | 0 | 1 |
| Central West | 0 | 0 | 0 | 0 | 0 | 0 |
| Wide Bay | 6 | 1 | 0 | 0 | 1 | 4 |
| Sunshine Coast | 11 | 1 | 2 | 1 | 1 | 6 |
| Metro North | 14 | 3 | 2 | 0 | 1 | 8 |
| Metro South | 14 | 3 | 1 | 0 | 1 | 9 |
| Darling Downs | 5 | 0 | 0 | 0 | 0 | 5 |
| West Moreton | 5 | 1 | 2 | 0 | 2 | 0 |
| South West | 0 | 0 | 0 | 0 | 0 | 0 |
| Gold Coast | 8 | 2 | 1 | 0 | 0 | 5 |
| Overseas resident | 0 | 0 | 0 | 0 | 0 | 0 |
| Total | 80 | 12 | 9 | 2 | 8 | 49 |
Cases reported
Number of COVID-19 cases reported for the week ending 21 April 2024 by age group and HHS of residence
HHS | All | under 5 | 5 to 17 | 18 to 64 | 65 to 74 | 75 plus |
|---|---|---|---|---|---|---|
| Torres and Cape | 3 | 0 | 0 | 3 | 0 | 0 |
| Cairns and Hinterland | 21 | 2 | 1 | 12 | 2 | 4 |
| North West | 4 | 1 | 0 | 3 | 0 | 0 |
| Townsville | 44 | 1 | 2 | 24 | 4 | 13 |
| Mackay | 21 | 4 | 0 | 12 | 3 | 2 |
| Central Queensland | 21 | 3 | 1 | 9 | 5 | 3 |
| Central West | 0 | 0 | 0 | 0 | 0 | 0 |
| Wide Bay | 57 | 7 | 2 | 13 | 9 | 26 |
| Sunshine Coast | 46 | 4 | 2 | 16 | 5 | 19 |
| Metro North | 202 | 15 | 16 | 106 | 26 | 39 |
| Metro South | 194 | 19 | 8 | 101 | 27 | 39 |
| Darling Downs | 56 | 3 | 3 | 18 | 8 | 24 |
| West Moreton | 57 | 8 | 3 | 28 | 9 | 9 |
| South West | 4 | 0 | 0 | 0 | 3 | 1 |
| Gold Coast | 87 | 3 | 6 | 40 | 12 | 26 |
| Overseas resident | 4 | 0 | 0 | 3 | 1 | 0 |
| Total | 821 | 70 | 44 | 388 | 114 | 205 |
2024 YTD | 22,088 | 1,638 | 1,120 | 10,380 | 2,934 | 6,016 |
Number of influenza cases reported for the week ending 21 April 2024 by age group and HHS of residence
HHS | All | under 6m | 6m to 4 yrs | 5 to 17 | 18 to 64 | 65 plus |
|---|---|---|---|---|---|---|
| Torres and Cape | 16 | 0 | 6 | 5 | 3 | 2 |
| Cairns and Hinterland | 40 | 0 | 4 | 6 | 19 | 11 |
| North West | 2 | 0 | 0 | 0 | 2 | 0 |
| Townsville | 98 | 0 | 14 | 14 | 50 | 20 |
| Mackay | 25 | 0 | 0 | 3 | 14 | 8 |
| Central Queensland | 25 | 0 | 5 | 4 | 11 | 5 |
| Central West | 1 | 0 | 0 | 0 | 1 | 0 |
| Wide Bay | 35 | 0 | 1 | 2 | 20 | 12 |
| Sunshine Coast | 26 | 0 | 4 | 3 | 13 | 6 |
| Metro North | 93 | 0 | 6 | 12 | 60 | 15 |
| Metro South | 152 | 0 | 17 | 29 | 86 | 20 |
| Darling Downs | 38 | 0 | 4 | 2 | 22 | 10 |
| West Moreton | 29 | 0 | 4 | 5 | 16 | 4 |
| South West | 3 | 0 | 0 | 0 | 1 | 2 |
| Gold Coast | 77 | 0 | 8 | 10 | 45 | 14 |
| Overseas resident | 2 | 0 | 0 | 0 | 2 | 0 |
| Total | 662 | 0 | 73 | 95 | 365 | 129 |
2024 YTD | 10752 | 46 | 1006 | 1922 | 5674 | 2104 |
Number of RSV cases reported for the week ending 21 April 2024 by age group and HHS of residence
HHS | All | under 6m | 6m to 23m | 2 to 4 yrs | 5 to 64 | 65 plus |
|---|---|---|---|---|---|---|
| Torres and Cape | 11 | 0 | 4 | 4 | 3 | 0 |
| Cairns and Hinterland | 37 | 2 | 4 | 6 | 9 | 16 |
| North West | 2 | 0 | 1 | 0 | 0 | 1 |
| Townsville | 82 | 13 | 13 | 25 | 18 | 13 |
| Mackay | 36 | 1 | 5 | 8 | 12 | 10 |
| Central Queensland | 13 | 0 | 4 | 3 | 3 | 3 |
| Central West | 4 | 1 | 1 | 1 | 1 | 0 |
| Wide Bay | 51 | 4 | 6 | 9 | 18 | 14 |
| Sunshine Coast | 103 | 4 | 27 | 13 | 23 | 36 |
| Metro North | 255 | 9 | 60 | 40 | 87 | 59 |
| Metro South | 366 | 27 | 96 | 59 | 119 | 65 |
| Darling Downs | 79 | 7 | 9 | 16 | 26 | 21 |
| West Moreton | 118 | 14 | 36 | 23 | 37 | 8 |
| South West | 7 | 1 | 2 | 1 | 3 | 0 |
| Gold Coast | 171 | 10 | 54 | 20 | 56 | 31 |
| Overseas resident | 1 | 0 | 0 | 1 | 0 | 0 |
| Total | 1,336 | 93 | 322 | 229 | 415 | 277 |
2024 YTD | 12,351 | 795 | 3,072 | 2,012 | 4,151 | 2,321 |
This report includes notifications for Queensland and overseas residents diagnosed with COVID-19, influenza or respiratory syncytial virus (RSV) in Queensland. Interstate residents diagnosed in Queensland are excluded from this report.
The number of persons hospitalised is a count of persons known to have the acute respiratory illness and to have been in a Queensland public hospital on that day.
Data are current at the time of this report. The total number of notifications may change day to day due to regular data quality activities and because additional cases have been notified to Queensland Health. This is a normal feature of live surveillance data.
Daily influenza report
Reporting ended 1 September 2023. This report is the final one for 2023.
Daily report on influenza cases in Queensland (PDF 112 kB)
Weekly influenza, Respiratory Syncytial Virus (RSV), and COVID-19
Queensland Health publishes weekly surveillance reports for influenza, Respiratory Syncytial Virus (RSV) and COVID-19 to monitor trends from a number of perspectives, including laboratory confirmed notifications and hospitalisations
Additional influenza information for health professionals.
Additional COVID-19 information.
Contact us if you have queries about Queensland reports or require copies of earlier Queensland reports.
Weekly cumulative surveillance reports
As the influenza season has ended this report will no longer be updated weekly. A final report, including data from 1 January to 31 December 2023, will be published early in 2024.
2023 Statewide weekly influenza and RSV surveillance report(PDF 2611 kB)
The COVID-19 surveillance report will no longer be updated weekly. A final report, including data from 1 January to 31 December 2023, will be published early in 2024.
2023 Statewide weekly COVID-19 surveillance report (PDF 381 kB)
Previous years
Final reports for previous years:
- 2022 Statewide weekly influenza surveillance report (PDF 446 kB) (Please note - the final weekly influenza surveillance report for 2022 was published on 13 September 2022)
- 2020 Statewide weekly influenza surveillance report (PDF 879 kB)
- 2019: Statewide weekly influenza surveillance report (PDF, 716KB)
- 2018: Statewide weekly influenza surveillance report (PDF, 828KB)
- 2017: Statewide weekly influenza surveillance report (PDF, 1.2MB)
- 2016: Statewide Weekly Influenza Surveillance Report (PDF, 1.2MB)
- 2015: Statewide Weekly Influenza Surveillance Report (PDF, 475KB)
- 2014: Statewide Weekly Influenza Surveillance Report (PDF, 397KB)
- 2013: Statewide Weekly Influenza Surveillance Report (PDF, 333KB)
- 2012: Statewide Weekly Influenza Surveillance Report (PDF, 253KB)
- 2011: Statewide Weekly Influenza Surveillance Report (PDF, 268KB)
- 2010: Statewide Weekly Influenza Surveillance Report (PDF, 78KB)
Annual reports
Commencing in 2016, Queensland Health will produce an annual report providing a descriptive data summary of the most recent influenza season in Queensland.
Download the report on Influenza in Queensland – 2013 - 2018 (PDF, 1MB)