Acute respiratory infection surveillance reporting
Weekly influenza, respiratory syncytial virus (RSV), and COVID-19
Queensland Health publishes weekly surveillance reports for influenza, Respiratory Syncytial Virus (RSV) and COVID-19 to monitor trends from a number of perspectives, including laboratory confirmed notifications and hospitalisations.
Queensland acute respiratory infection surveillance report 1 January - 12 July 2026 (PDF 1214 kB)
ARI Genomic Reports
Queensland COVID genomics epidemiology summary 25 June 2026 (PDF 135 kB)
Queensland influenza virus genomic surveillance report 15 May 2026 (PDF 1129 kB)
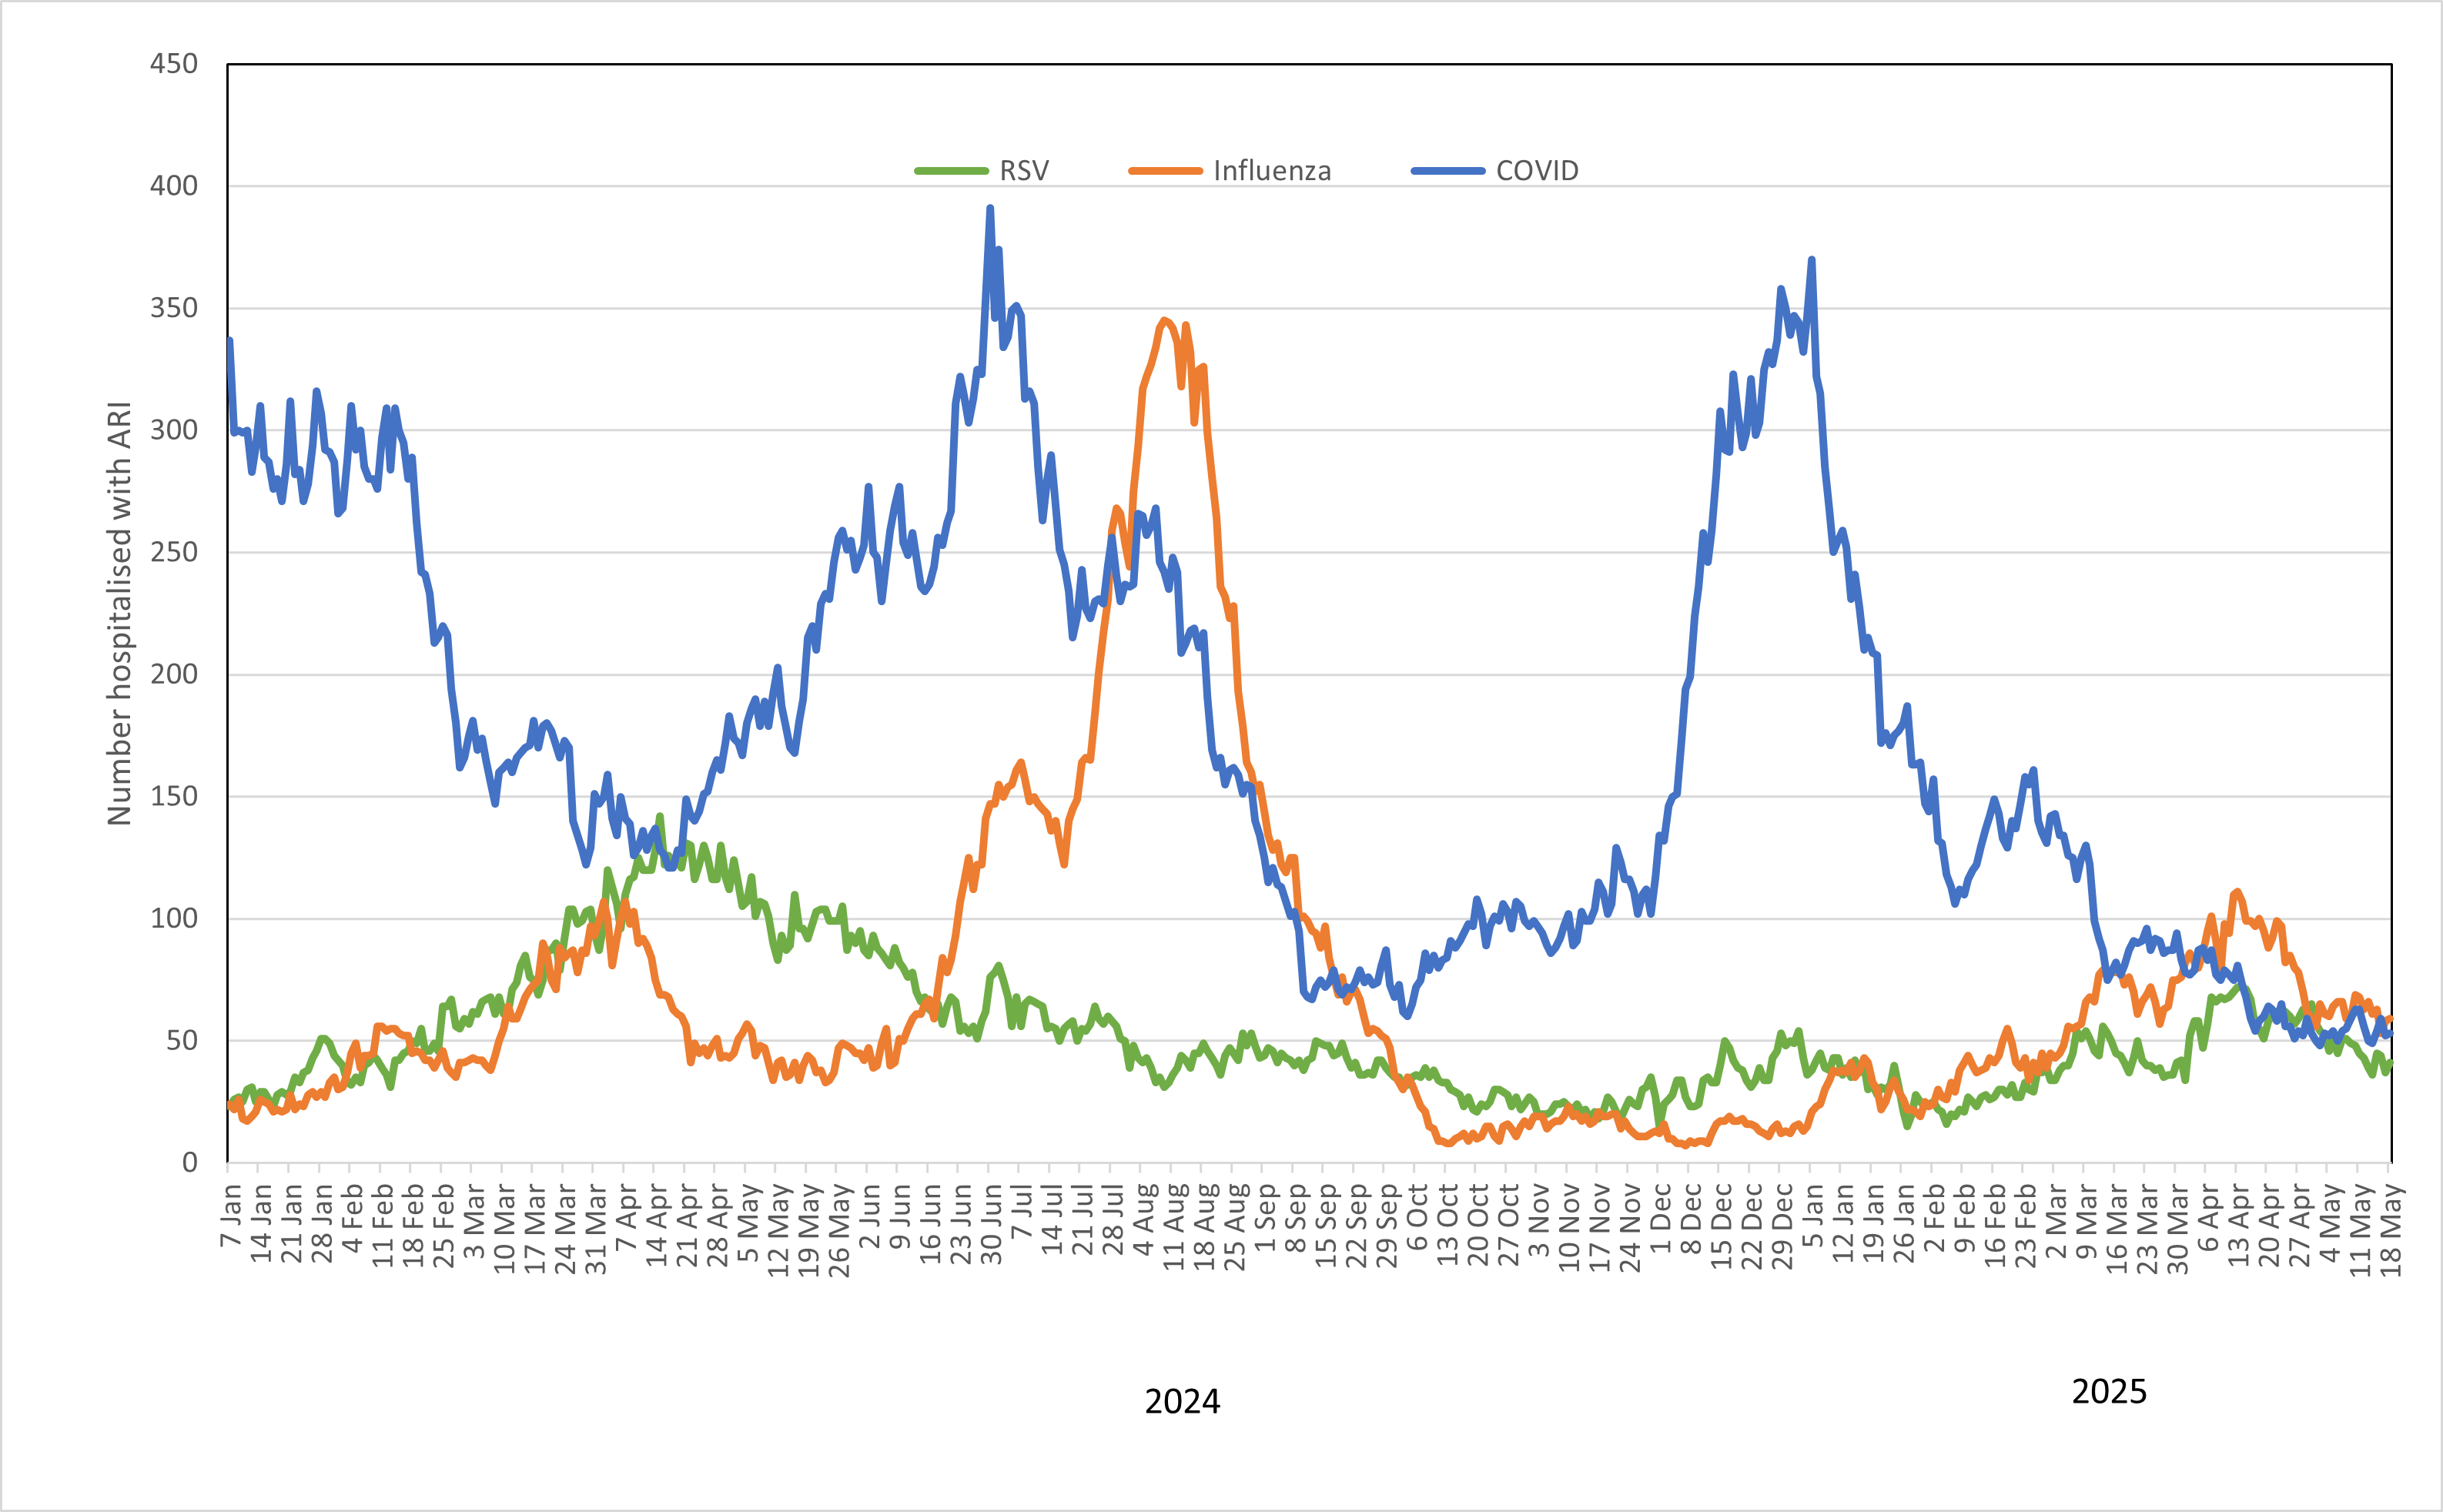
Number of persons hospitalised with COVID-19, Influenza, RSV in Queensland
Number of persons hospitalised with COVID-19, Influenza or RSV in Queensland since 1 January 2025.
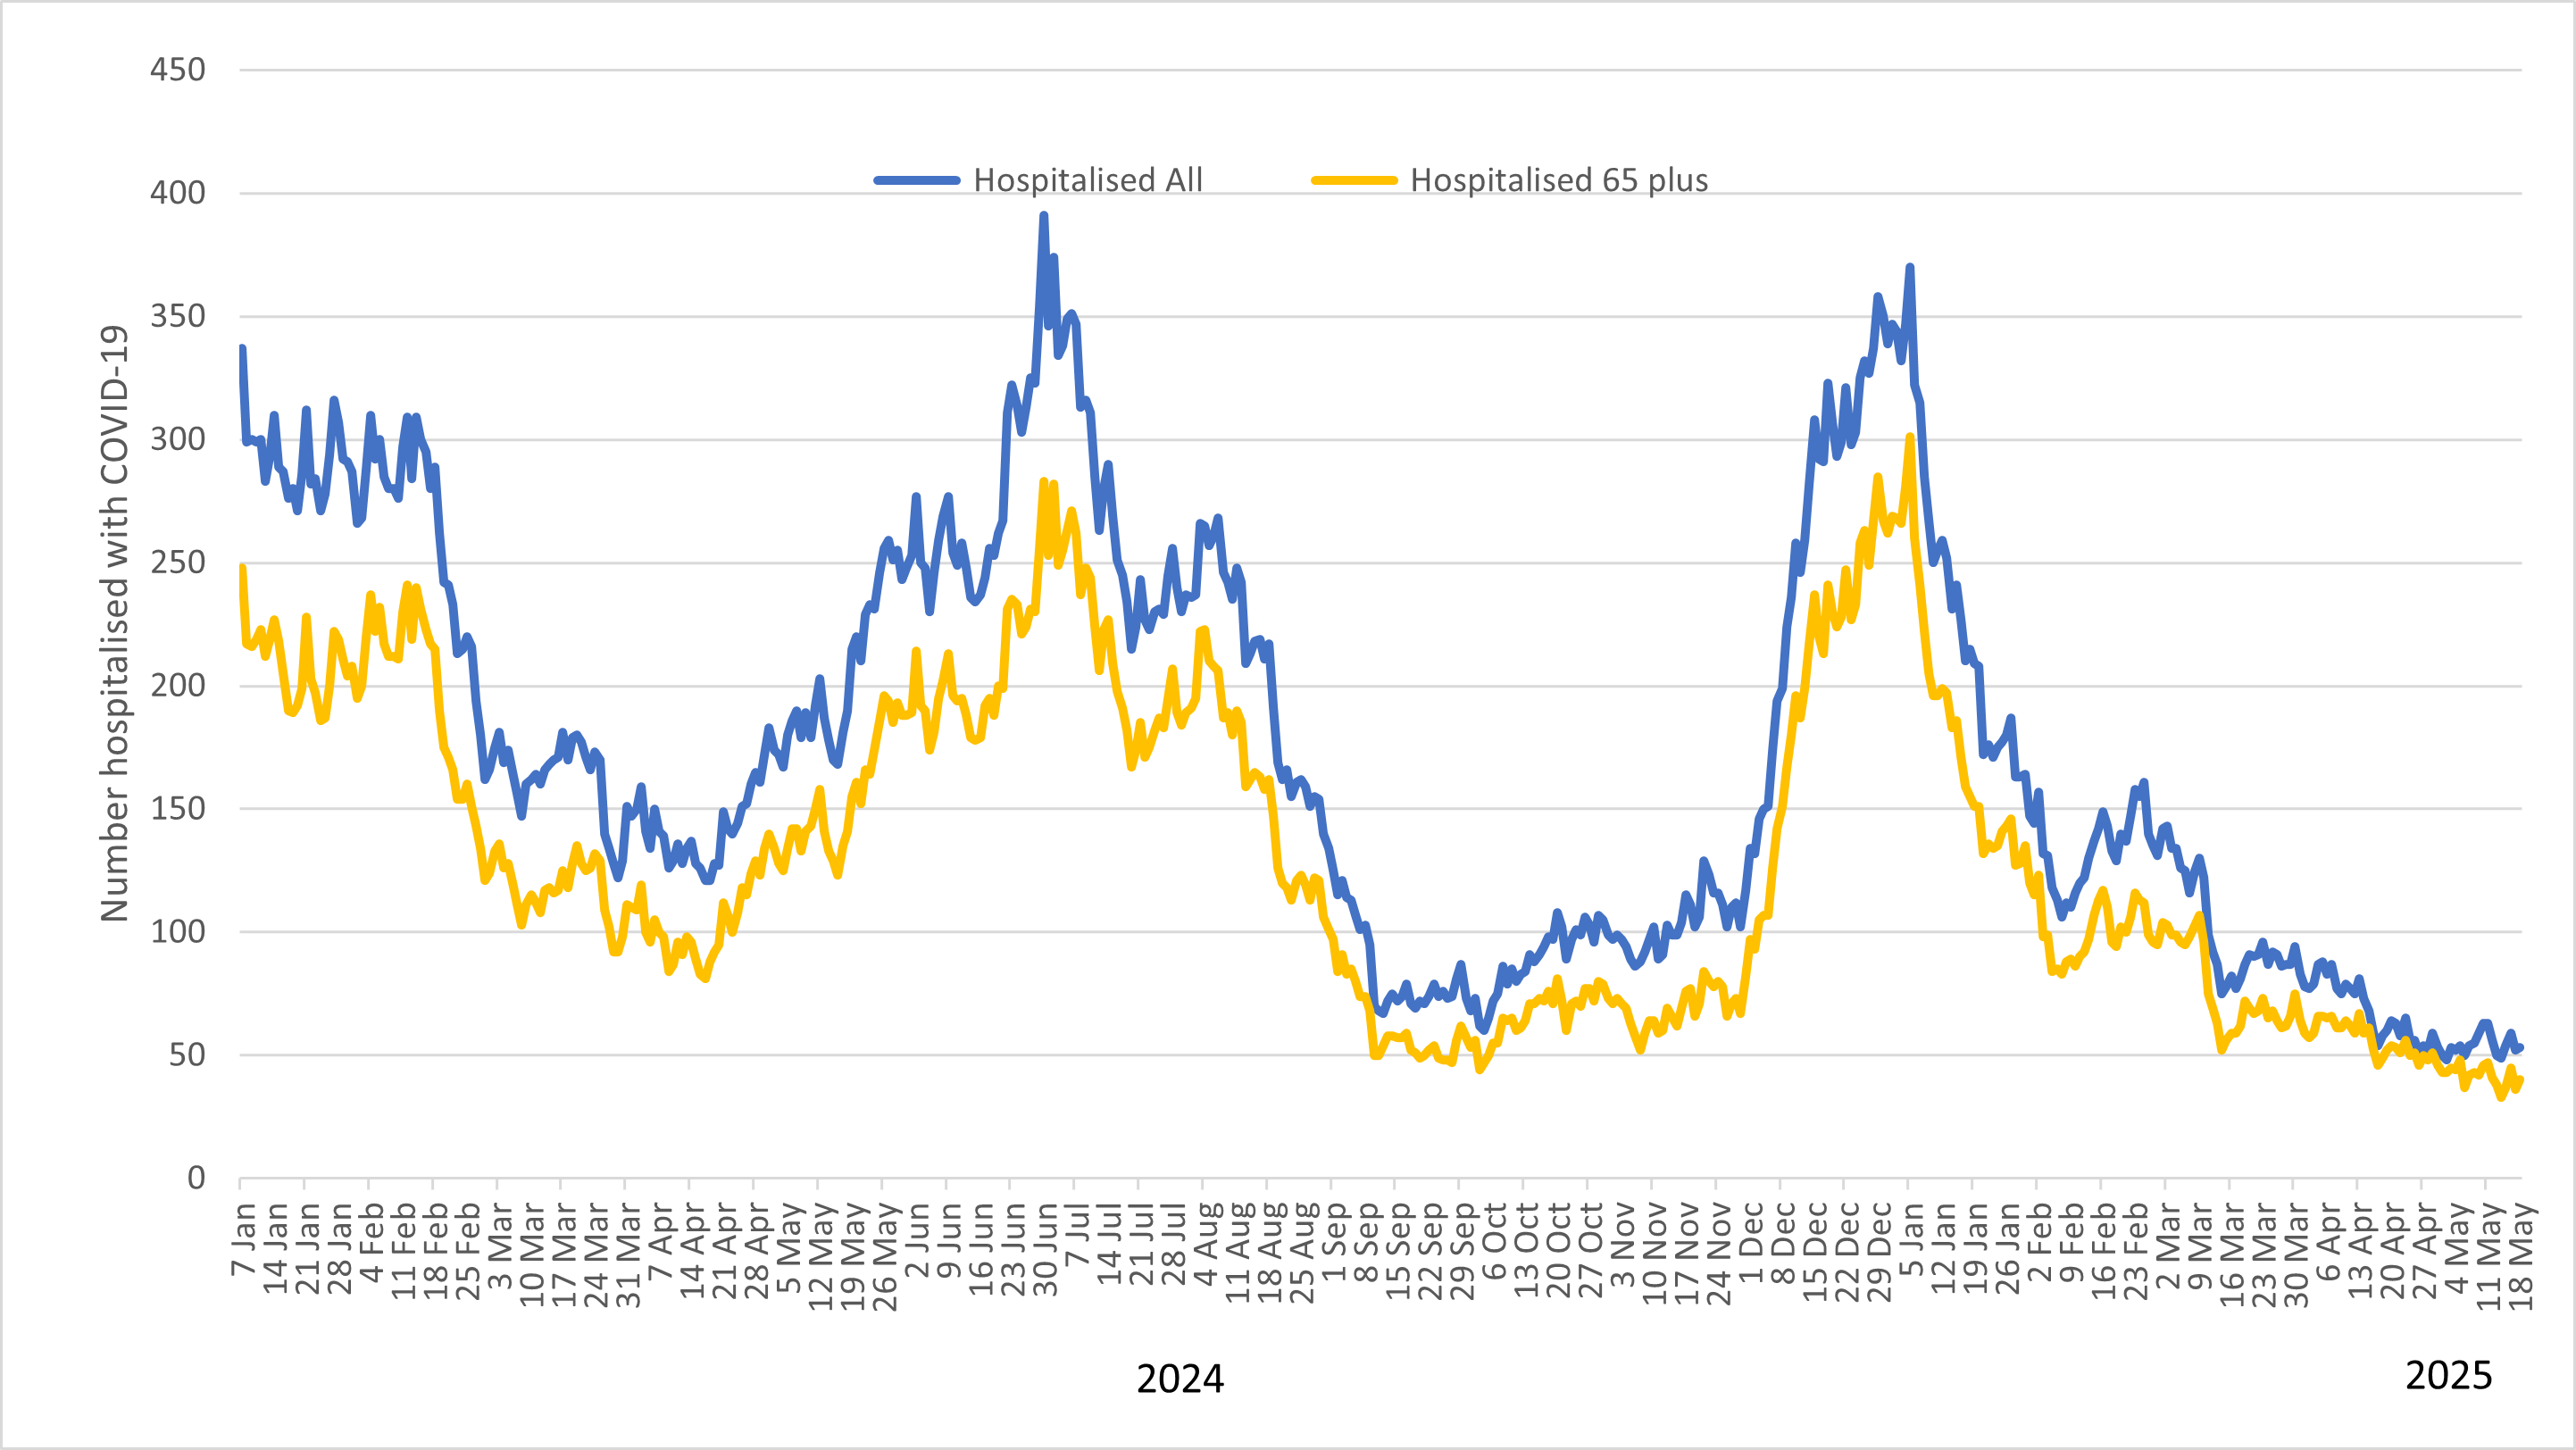
Number of persons hospitalised with COVID-19 in Queensland since 1 January 2025.
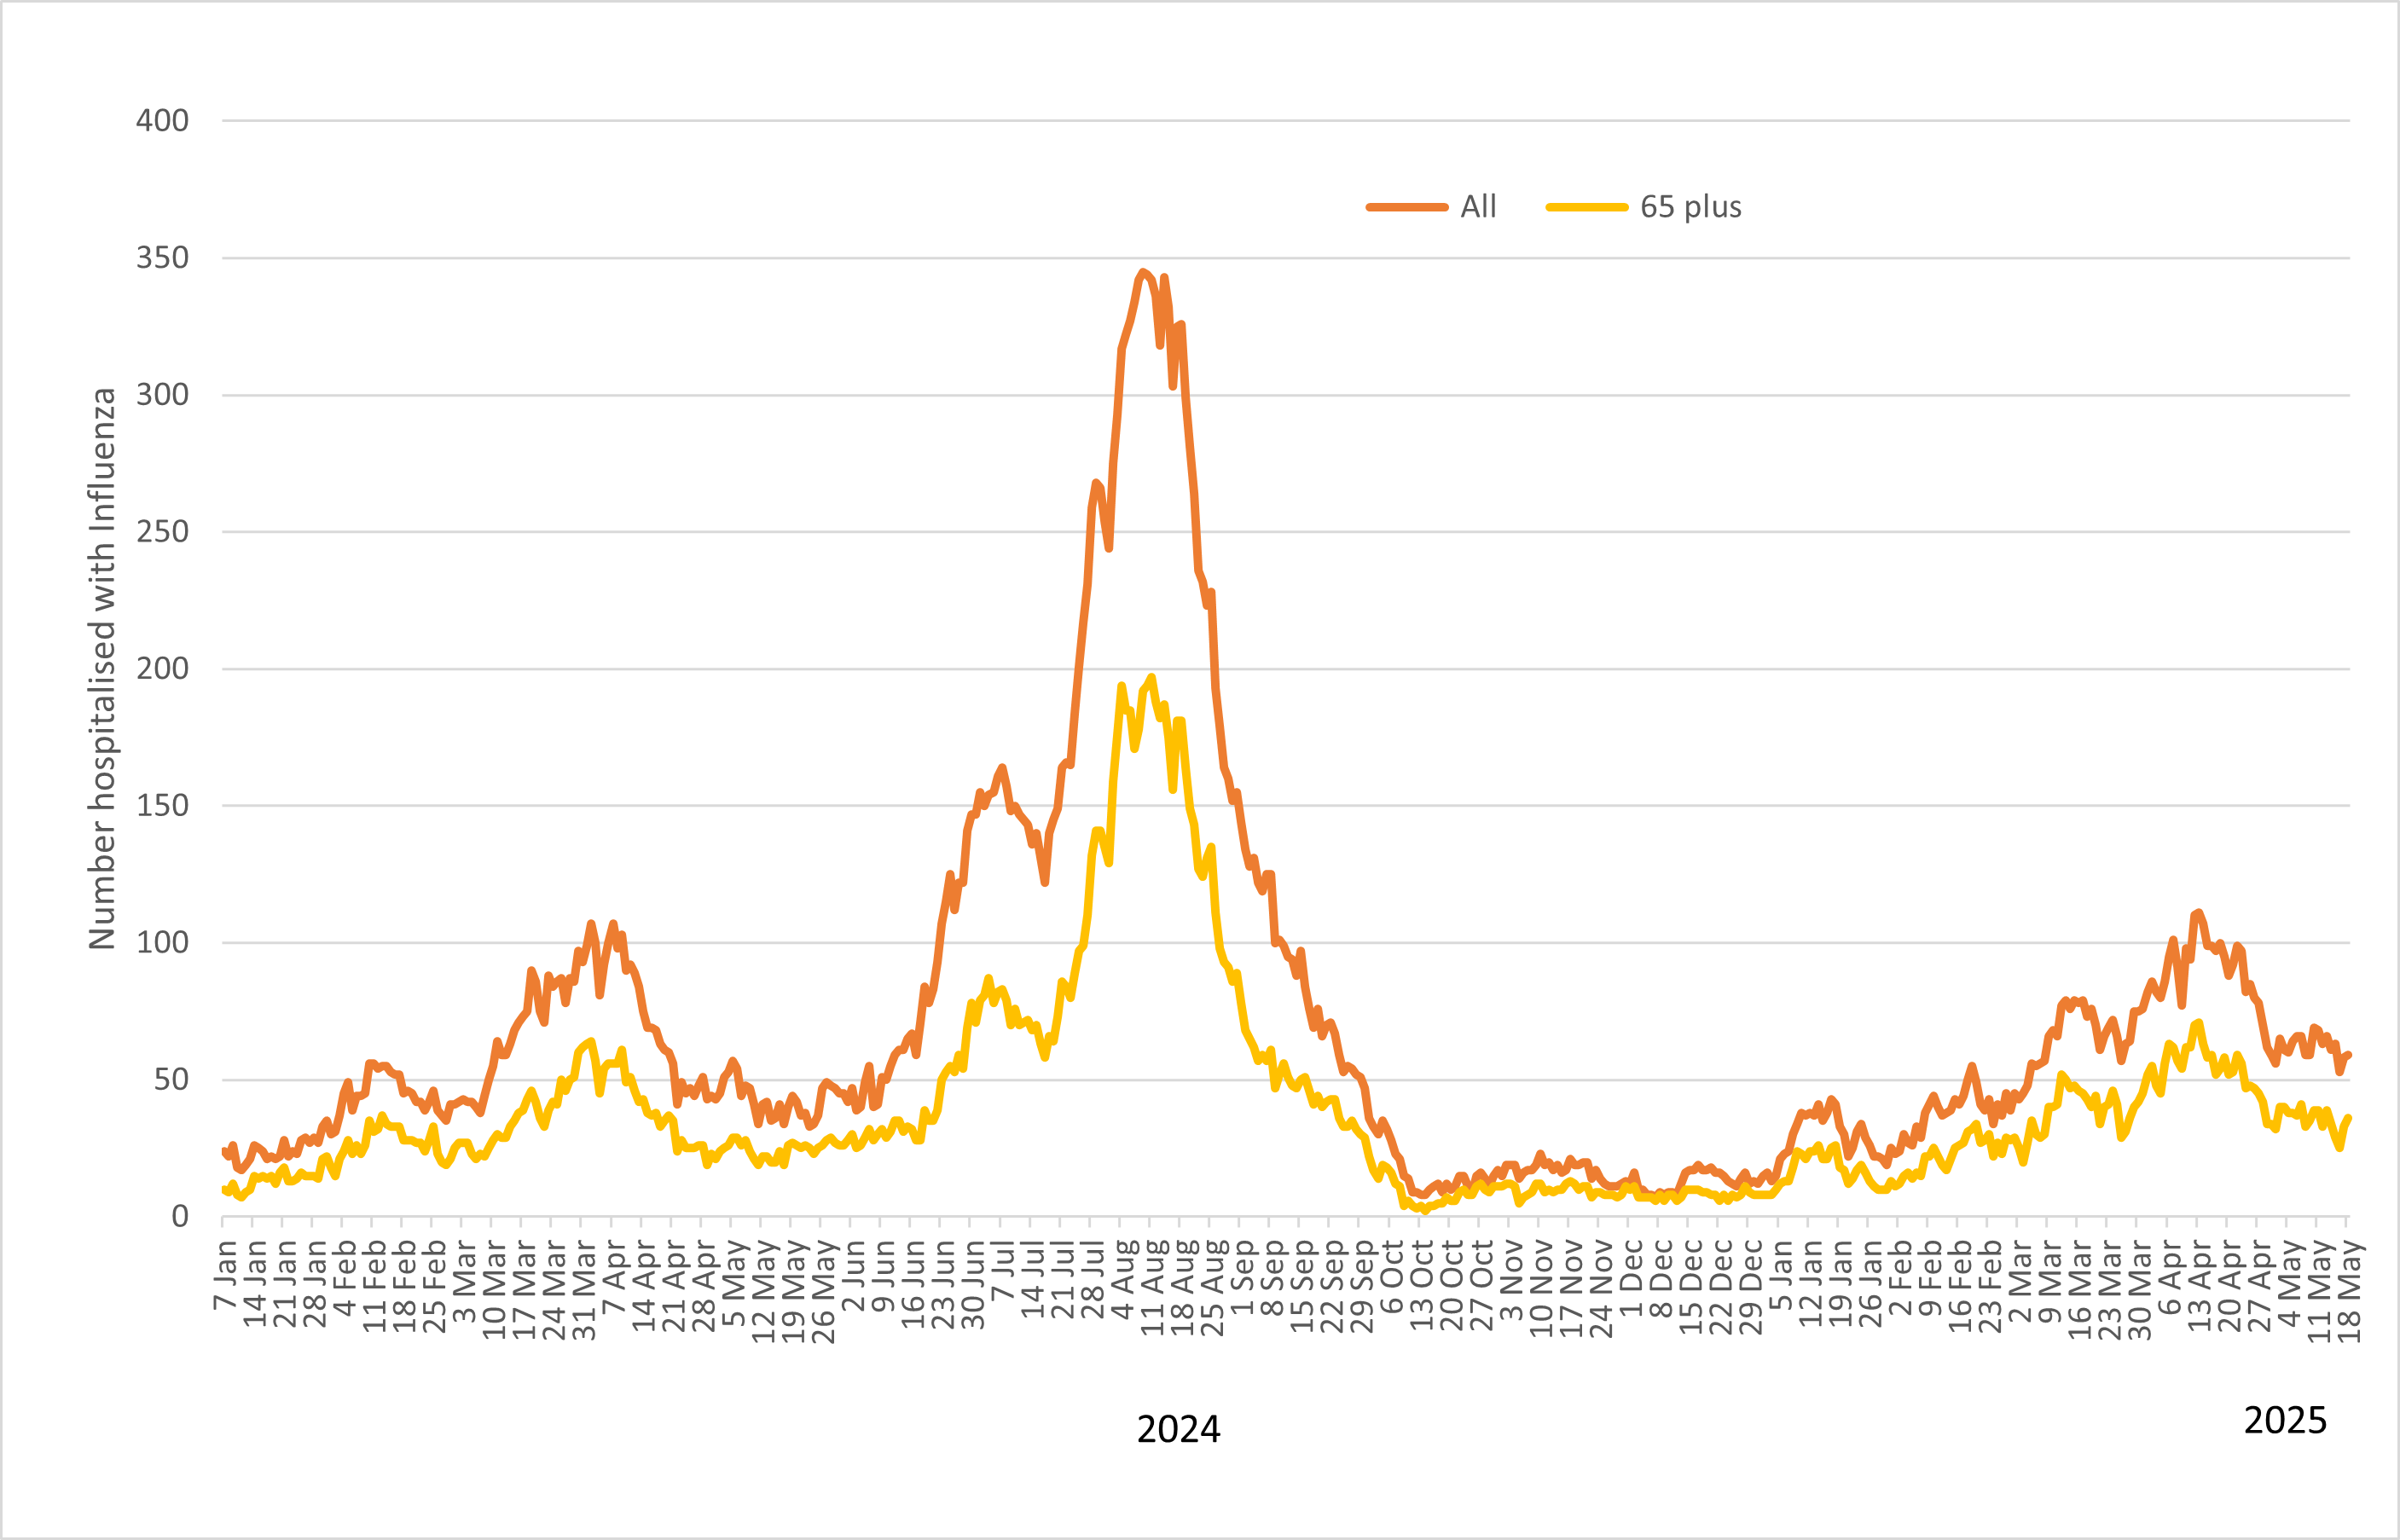
Number of persons hospitalised with Influenza in Queensland since 1 January 2025.
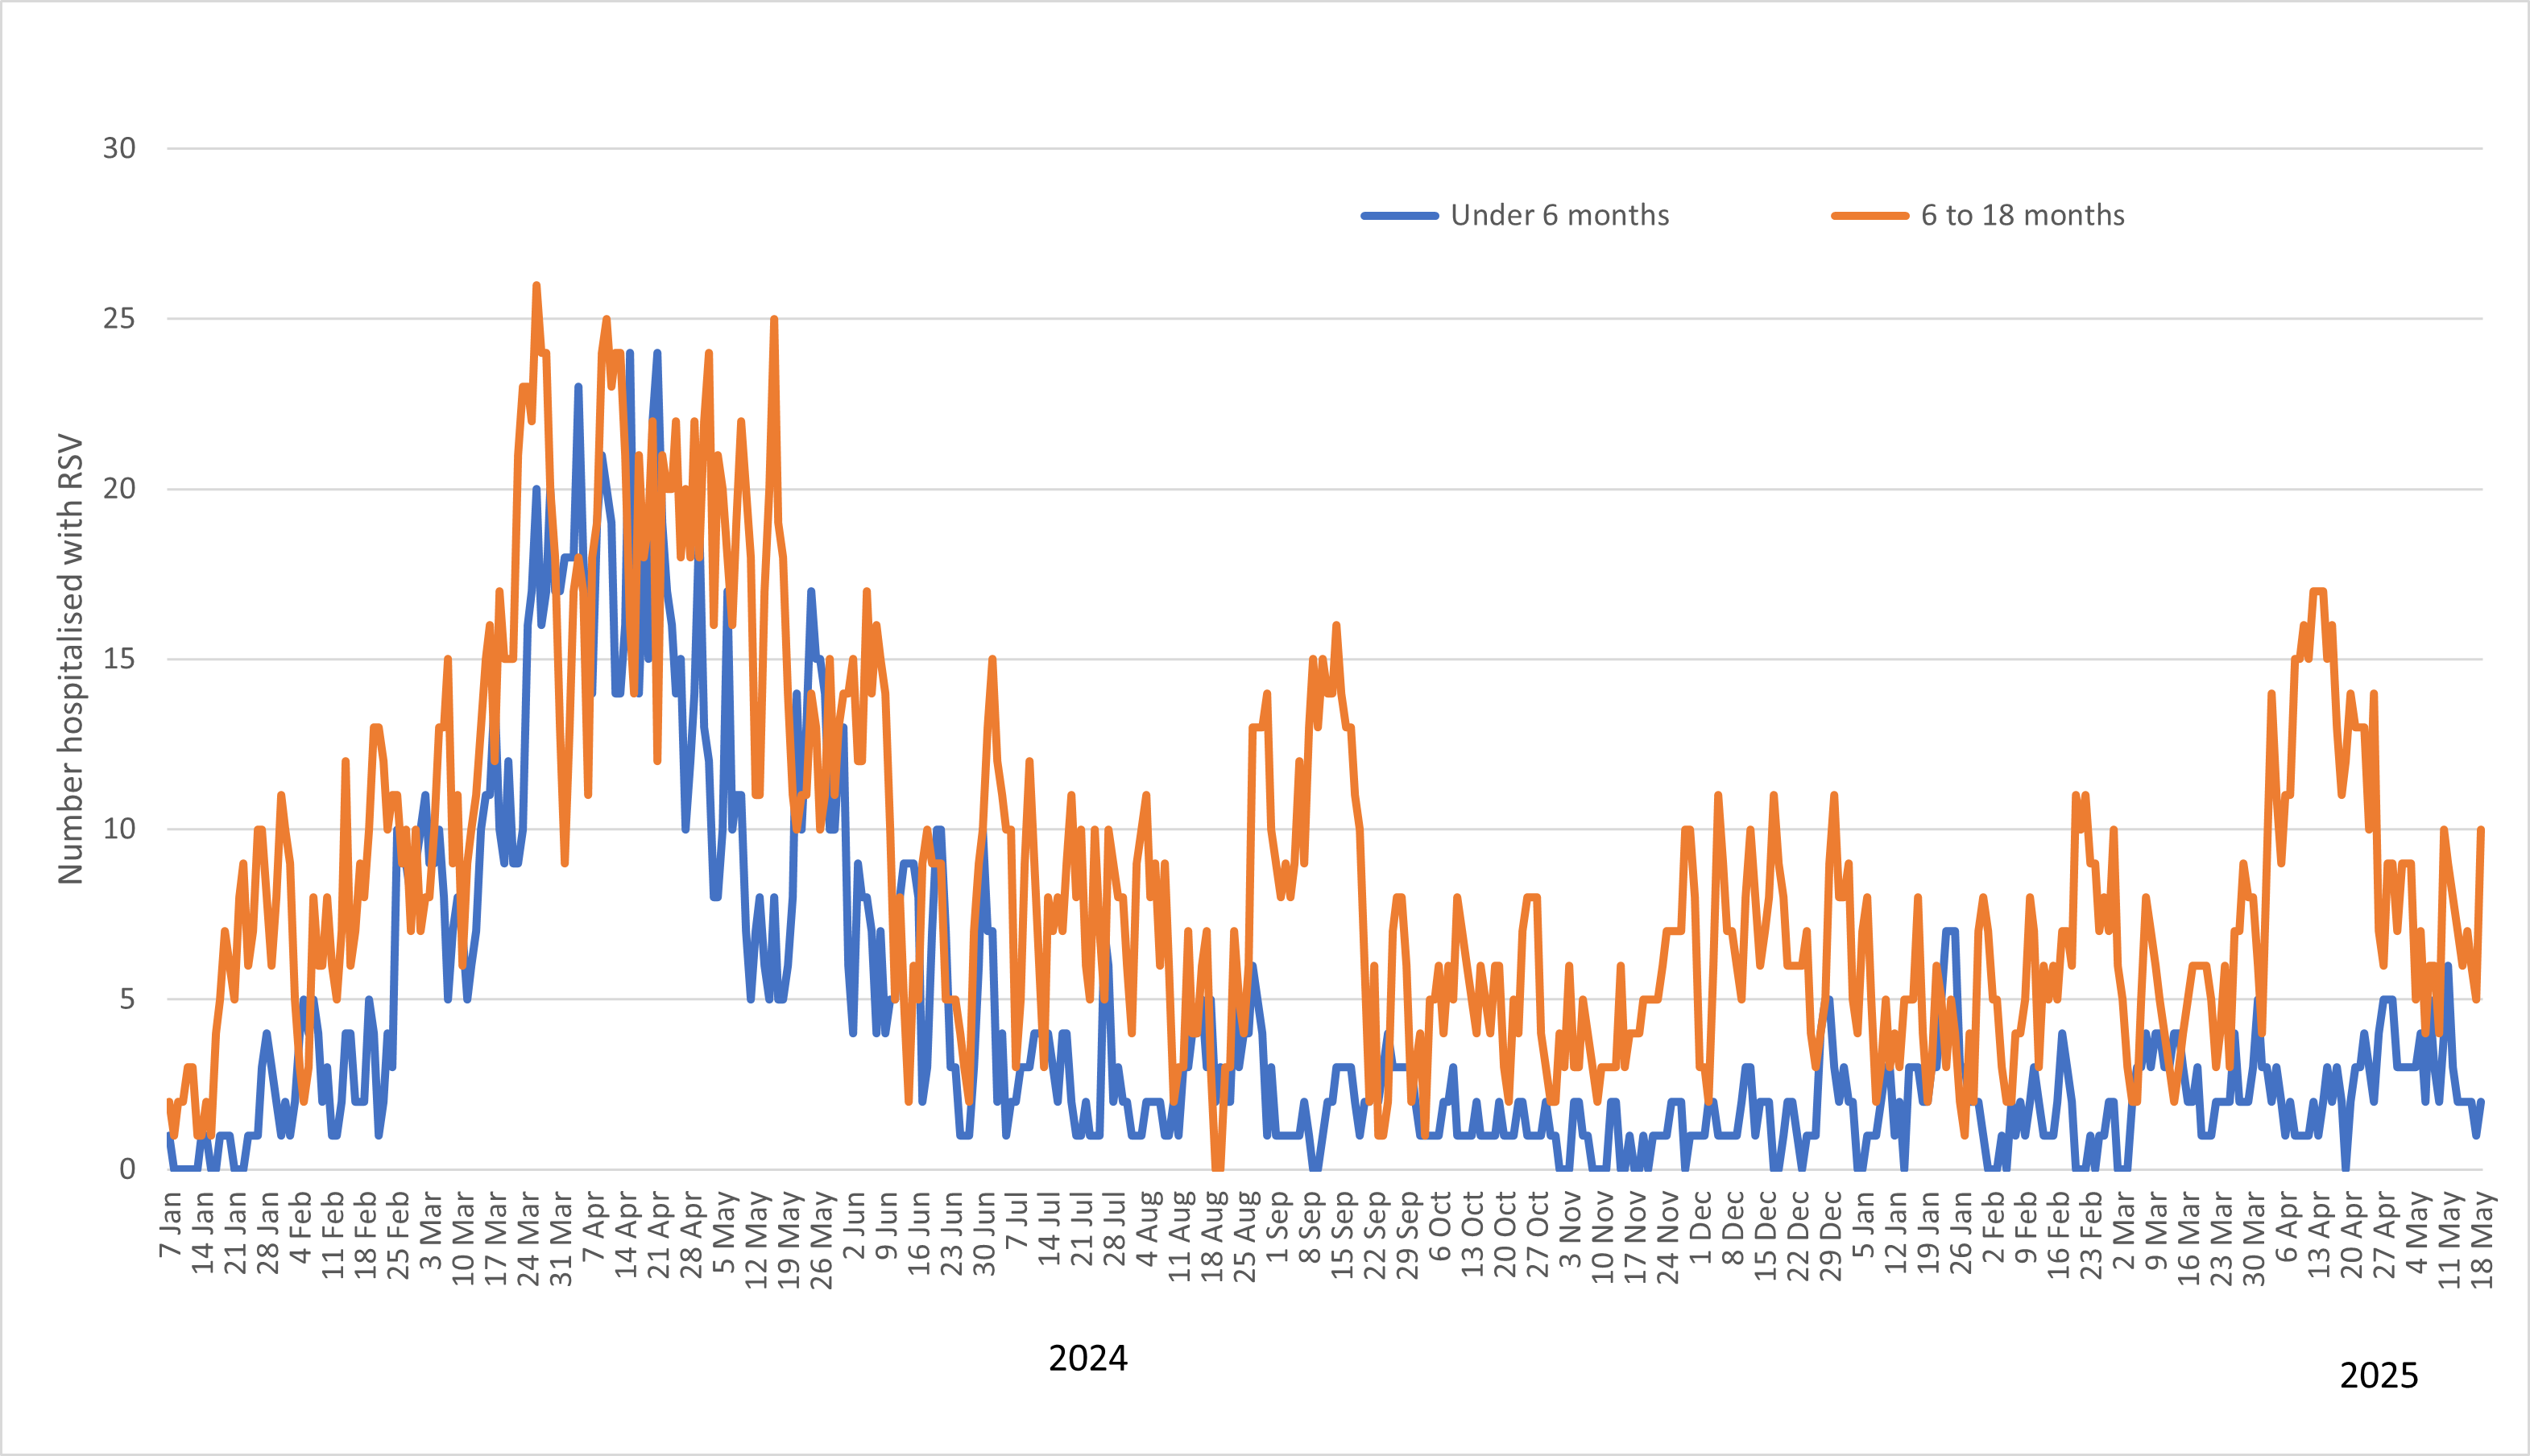
Number of persons hospitalised with RSV in Queensland since 1 January 2025.
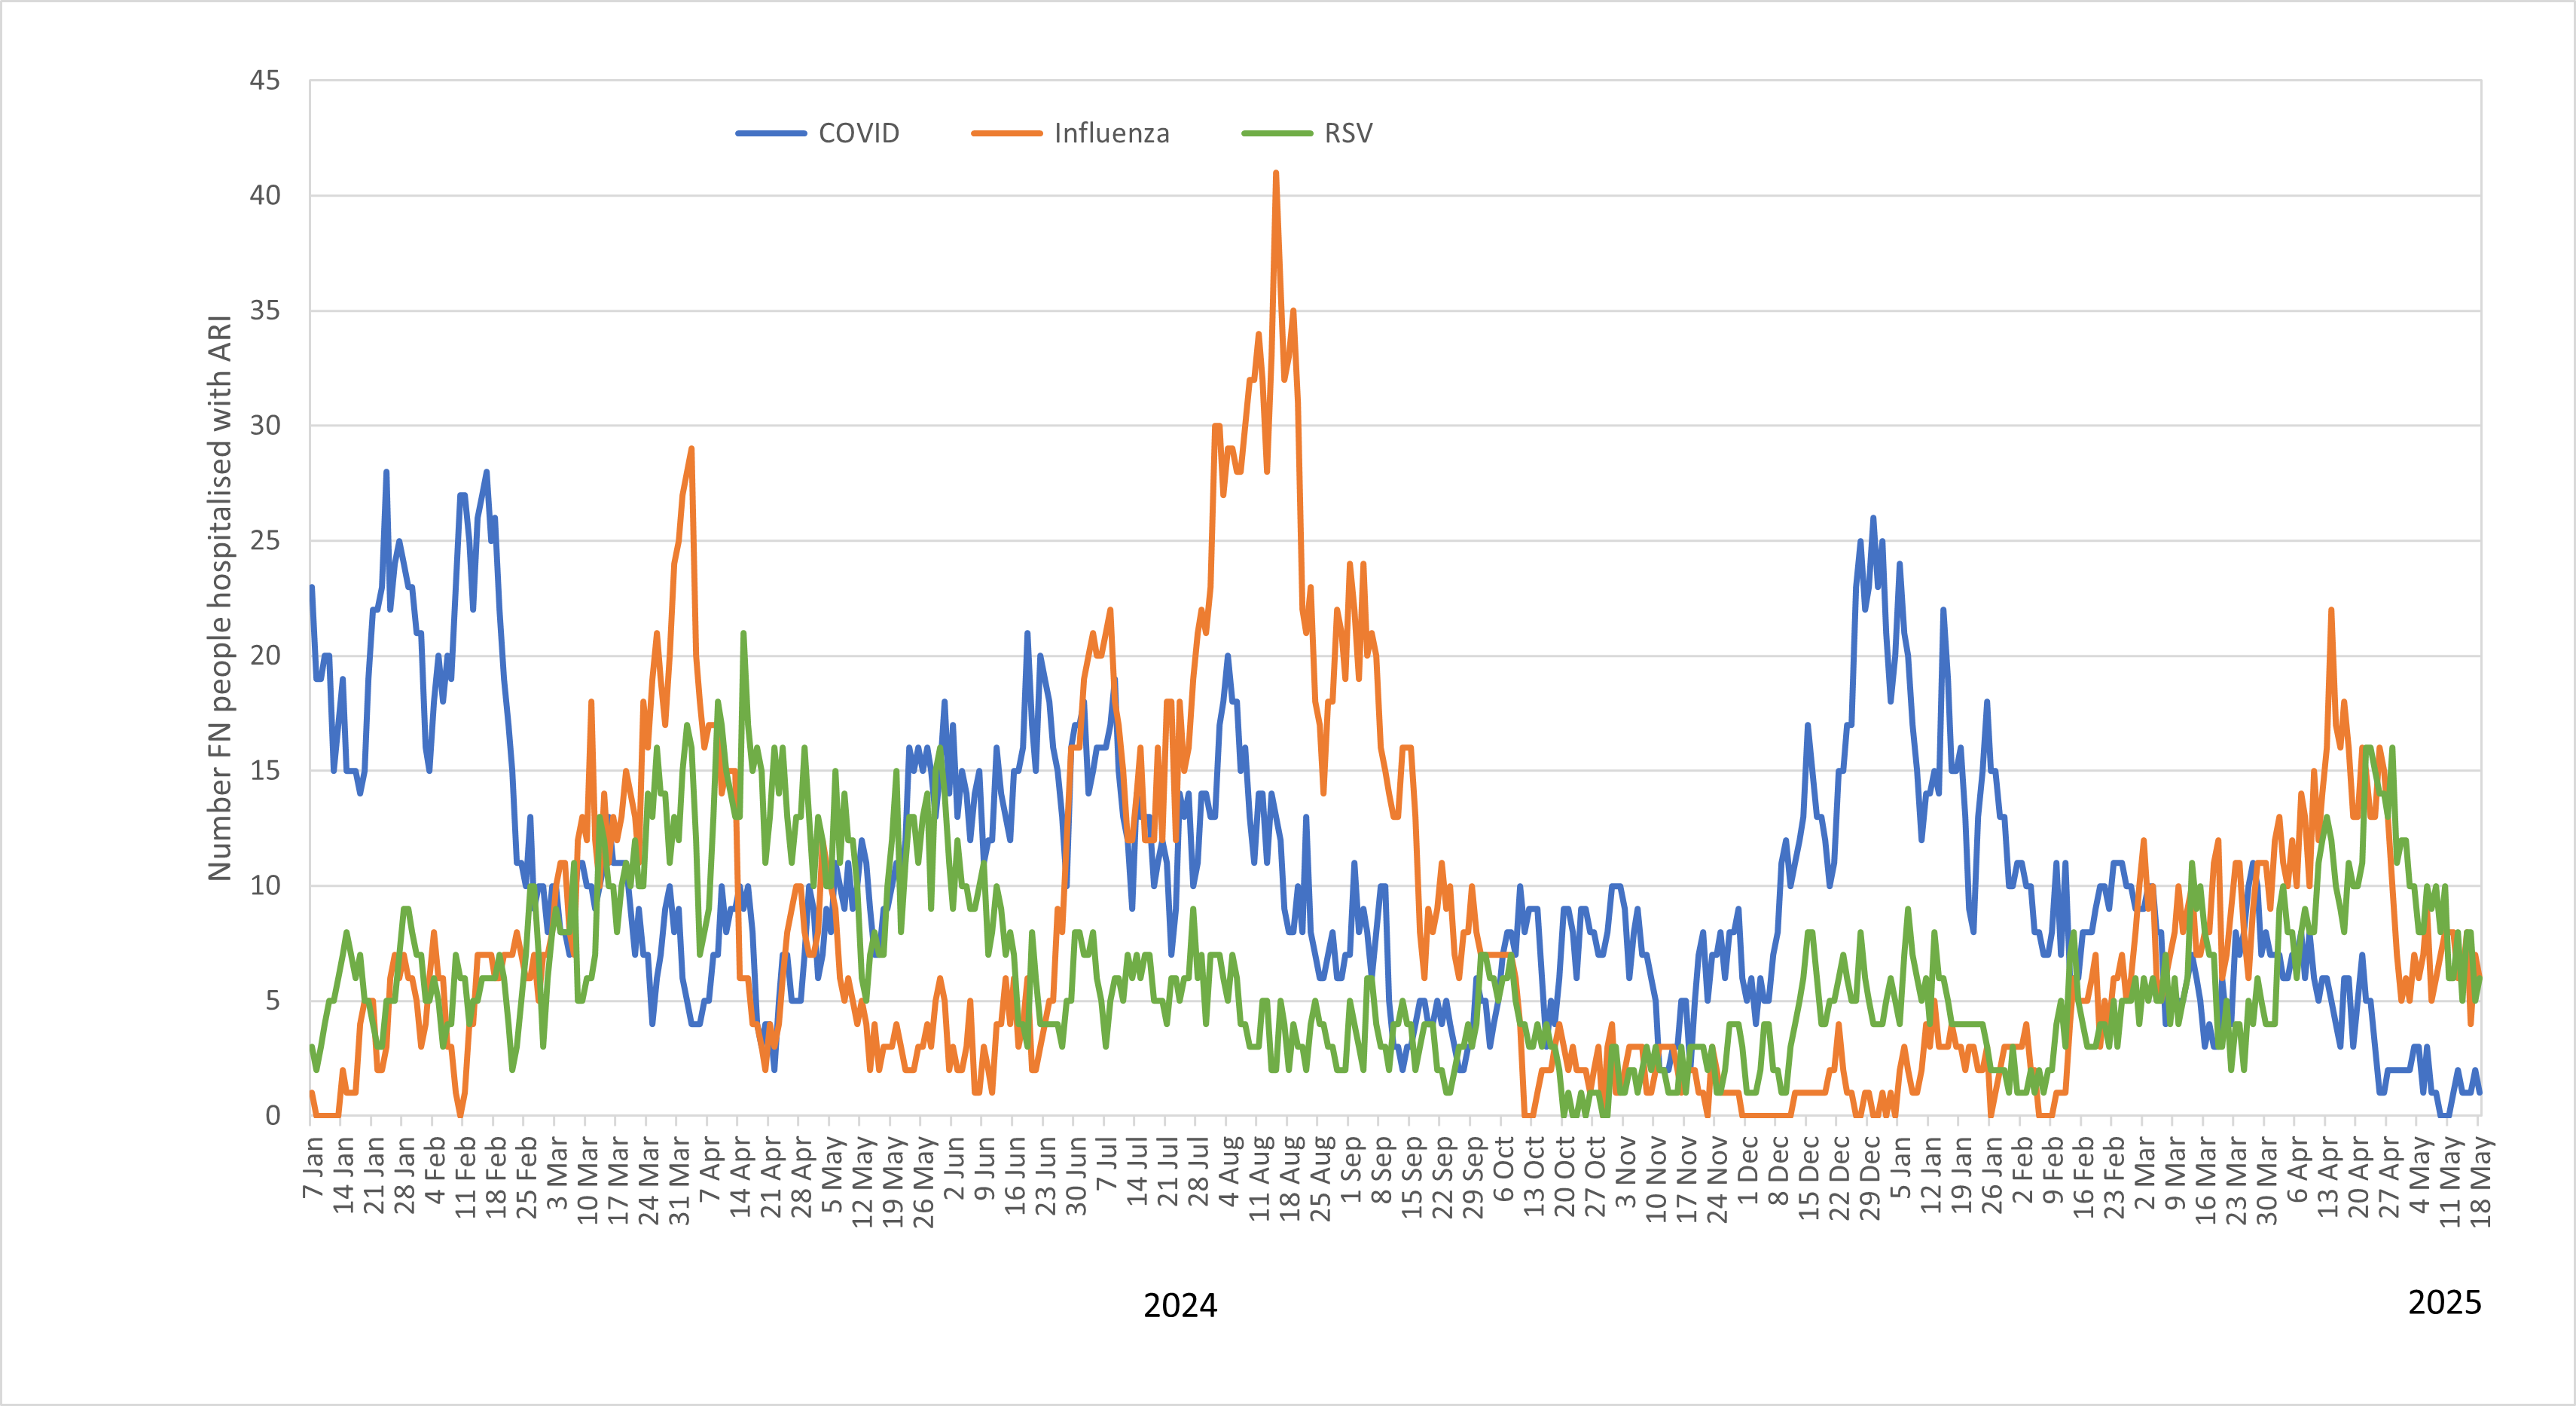
Number of First Nations persons hospitalised with COVID-19, Influenza or RSV in Queensland since 1 January 2025.
Data extracted on 13 July 2026
COVID-19
20 people were in hospital with COVID-19, three (15%) were aged 65–74 years and 11 (55%) were 75 years or more.
200 people diagnosed in the last week, 27 (14%) were aged 65–74 years and 40 (20%) were 75 years or more.
Influenza
12 people were in hospital with Influenza, three (25%) were aged 65 years or more.
271 people diagnosed in the last week, 29 (11%) were aged 65 years or more.
Respiratory Syncytial Virus (RSV)
49 people were in hospital with RSV, four (8%) were under 6 months of age and seven (14%) were aged between 6 months to less than 2 years.
737 people diagnosed in the last week, 28 (4%) were under 6 months of age and 144 (20%) were aged between 6 months to less than 2 years.
Number of persons hospitalised
Number of persons in hospital with COVID-19 by age group and HHS of residence – snapshot on 12 July 2026
HHS | All | under 5 | 5 to 17 | 18 to 64 | 65 to 74 | 75 plus |
|---|---|---|---|---|---|---|
| Torres and Cape | 1 | 0 | 1 | 0 | 0 | 0 |
| Cairns and Hinterland | 2 | 0 | 0 | 1 | 1 | 0 |
| North West | 0 | 0 | 0 | 0 | 0 | 0 |
| Townsville | 1 | 0 | 0 | 1 | 0 | 0 |
| Mackay | 0 | 0 | 0 | 0 | 0 | 0 |
| Central Queensland | 0 | 0 | 0 | 0 | 0 | 0 |
| Central West | 0 | 0 | 0 | 0 | 0 | 0 |
| Wide Bay | 2 | 0 | 0 | 0 | 0 | 2 |
| Sunshine Coast | 1 | 0 | 0 | 0 | 0 | 1 |
| Metro North | 7 | 0 | 0 | 2 | 2 | 3 |
| Metro South | 2 | 0 | 0 | 1 | 0 | 1 |
| Darling Downs | 0 | 0 | 0 | 0 | 0 | 0 |
| West Moreton | 0 | 0 | 0 | 0 | 0 | 0 |
| South West | 0 | 0 | 0 | 0 | 0 | 0 |
| Gold Coast | 4 | 0 | 0 | 0 | 0 | 4 |
| Overseas resident | 0 | 0 | 0 | 0 | 0 | 0 |
| Total | 20 | 0 | 1 | 5 | 3 | 11 |
Number of persons in hospital with influenza by age group and HHS of residence – snapshot on 12 July 2026
HHS | All | under 6m | 6m to 4 yrs | 5 to 17 | 18 to 64 | 65 plus |
|---|---|---|---|---|---|---|
| Torres and Cape | 0 | 0 | 0 | 0 | 0 | 0 |
| Cairns and Hinterland | 0 | 0 | 0 | 0 | 0 | 0 |
| North West | 0 | 0 | 0 | 0 | 0 | 0 |
| Townsville | 1 | 0 | 0 | 0 | 0 | 1 |
| Mackay | 0 | 0 | 0 | 0 | 0 | 0 |
| Central Queensland | 0 | 0 | 0 | 0 | 0 | 0 |
| Central West | 0 | 0 | 0 | 0 | 0 | 0 |
| Wide Bay | 1 | 0 | 0 | 0 | 0 | 1 |
| Sunshine Coast | 1 | 0 | 0 | 0 | 0 | 1 |
| Metro North | 1 | 1 | 0 | 0 | 0 | 0 |
| Metro South | 3 | 0 | 1 | 0 | 2 | 0 |
| Darling Downs | 0 | 0 | 0 | 0 | 0 | 0 |
| West Moreton | 2 | 0 | 0 | 1 | 1 | 0 |
| South West | 0 | 0 | 0 | 0 | 0 | 0 |
| Gold Coast | 3 | 0 | 0 | 1 | 2 | 0 |
| Overseas resident | 0 | 0 | 0 | 0 | 0 | 0 |
| Total | 12 | 1 | 1 | 2 | 5 | 3 |
Number of persons in hospital with RSV by age group and HHS of residence – snapshot on 12 July 2026
HHS | All | under 6m | 6m to 4 yrs | 5 to 17 | 18 to 64 | 65 plus |
|---|---|---|---|---|---|---|
| Torres and Cape | 0 | 0 | 0 | 0 | 0 | 0 |
| Cairns and Hinterland | 2 | 0 | 0 | 0 | 1 | 1 |
| North West | 0 | 0 | 0 | 0 | 0 | 0 |
| Townsville | 3 | 0 | 1 | 0 | 0 | 2 |
| Mackay | 0 | 0 | 0 | 0 | 0 | 0 |
| Central Queensland | 4 | 1 | 0 | 1 | 1 | 1 |
| Central West | 0 | 0 | 0 | 0 | 0 | 0 |
| Wide Bay | 3 | 0 | 0 | 0 | 1 | 2 |
| Sunshine Coast | 0 | 0 | 0 | 0 | 0 | 0 |
| Metro North | 12 | 1 | 3 | 0 | 1 | 7 |
| Metro South | 7 | 1 | 3 | 0 | 1 | 2 |
| Darling Downs | 3 | 0 | 0 | 0 | 0 | 3 |
| West Moreton | 10 | 1 | 0 | 0 | 3 | 6 |
| South West | 0 | 0 | 0 | 0 | 0 | 0 |
| Gold Coast | 5 | 0 | 0 | 0 | 0 | 5 |
| Overseas resident | 0 | 0 | 0 | 0 | 0 | 0 |
| Total | 49 | 4 | 7 | 1 | 8 | 29 |
Cases reported
Number of COVID-19 cases reported for the week ending 12 July 2026 by age group and HHS of residence
HHS | All | under 5 | 5 to 17 | 18 to 64 | 65 to 74 | 75 plus |
|---|---|---|---|---|---|---|
| Torres and Cape | 1 | 0 | 1 | 0 | 0 | 0 |
| Cairns and Hinterland | 4 | 0 | 0 | 2 | 2 | 0 |
| North West | 0 | 0 | 0 | 0 | 0 | 0 |
| Townsville | 3 | 0 | 0 | 1 | 0 | 2 |
| Mackay | 4 | 2 | 0 | 2 | 0 | 0 |
| Central Queensland | 10 | 5 | 0 | 3 | 1 | 1 |
| Central West | 0 | 0 | 0 | 0 | 0 | 0 |
| Wide Bay | 8 | 0 | 0 | 7 | 0 | 1 |
| Sunshine Coast | 8 | 3 | 0 | 3 | 0 | 2 |
| Metro North | 49 | 3 | 2 | 25 | 7 | 12 |
| Metro South | 56 | 8 | 1 | 28 | 9 | 10 |
| Darling Downs | 10 | 2 | 1 | 5 | 1 | 1 |
| West Moreton | 16 | 1 | 1 | 10 | 2 | 2 |
| South West | 0 | 0 | 0 | 0 | 0 | 0 |
| Gold Coast | 30 | 4 | 0 | 13 | 5 | 8 |
| Overseas resident | 1 | 0 | 0 | 0 | 0 | 1 |
| Total | 200 | 28 | 6 | 99 | 27 | 40 |
| 2026 YTD | 10,528 | 1,656 | 1,132 | 4,665 | 1,015 | 2,060 |
Number of influenza cases reported for the week ending 12 July 2026 by age group and HHS of residence
HHS | All | under 6m | 6m to 4 yrs | 5 to 17 | 18 to 64 | 65 plus |
|---|---|---|---|---|---|---|
| Torres and Cape | 0 | 0 | 0 | 0 | 0 | 0 |
| Cairns and Hinterland | 8 | 0 | 1 | 1 | 4 | 2 |
| North West | 0 | 0 | 0 | 0 | 0 | 0 |
| Townsville | 11 | 1 | 0 | 1 | 9 | 0 |
| Mackay | 10 | 0 | 1 | 2 | 6 | 1 |
| Central Queensland | 8 | 0 | 2 | 2 | 4 | 0 |
| Central West | 1 | 0 | 0 | 0 | 1 | 0 |
| Wide Bay | 11 | 0 | 1 | 5 | 3 | 2 |
| Sunshine Coast | 22 | 0 | 3 | 7 | 9 | 3 |
| Metro North | 54 | 2 | 6 | 8 | 32 | 6 |
| Metro South | 75 | 0 | 13 | 8 | 45 | 9 |
| Darling Downs | 6 | 0 | 1 | 0 | 3 | 2 |
| West Moreton | 15 | 0 | 3 | 5 | 6 | 1 |
| South West | 0 | 0 | 0 | 0 | 0 | 0 |
| Gold Coast | 49 | 1 | 5 | 11 | 29 | 3 |
| Overseas resident | 1 | 0 | 0 | 0 | 1 | 0 |
| Total | 271 | 4 | 36 | 50 | 152 | 29 |
| 2026 YTD | 11055 | 68 | 1312 | 2747 | 4864 | 2064 |
Number of RSV cases reported for the week ending 12 July 2026 by age group and HHS of residence
HHS | All | under 6m | 6m to 23m | 2 to 4 yrs | 5 to 64 | 65 plus |
|---|---|---|---|---|---|---|
| Torres and Cape | 2 | 0 | 0 | 0 | 2 | 0 |
| Cairns and Hinterland | 8 | 1 | 0 | 0 | 2 | 5 |
| North West | 3 | 0 | 0 | 1 | 2 | 0 |
| Townsville | 12 | 1 | 1 | 0 | 3 | 7 |
| Mackay | 7 | 0 | 0 | 2 | 4 | 1 |
| Central Queensland | 32 | 4 | 6 | 6 | 11 | 5 |
| Central West | 1 | 0 | 0 | 0 | 0 | 1 |
| Wide Bay | 30 | 2 | 2 | 6 | 15 | 5 |
| Sunshine Coast | 39 | 1 | 7 | 5 | 14 | 12 |
| Metro North | 143 | 4 | 34 | 29 | 45 | 31 |
| Metro South | 210 | 4 | 36 | 35 | 97 | 38 |
| Darling Downs | 69 | 3 | 17 | 18 | 18 | 13 |
| West Moreton | 83 | 6 | 17 | 13 | 21 | 26 |
| South West | 5 | 0 | 2 | 0 | 2 | 1 |
| Gold Coast | 93 | 2 | 22 | 15 | 31 | 23 |
| Overseas resident | 0 | 0 | 0 | 0 | 0 | 0 |
| Total | 737 | 28 | 144 | 130 | 267 | 168 |
| 2026 YTD | 17,438 | 527 | 3,932 | 2,761 | 6,227 | 3,991 |
This report includes notifications for Queensland and overseas residents diagnosed with COVID-19, influenza or respiratory syncytial virus (RSV) in Queensland. Interstate residents diagnosed in Queensland are excluded from this report.
The number of persons hospitalised is a count of persons known to have the acute respiratory illness and to have been in a Queensland public hospital on that day.
Data are current at the time of this report. The total number of notifications may change day to day due to regular data quality activities and because additional cases have been notified to Queensland Health. This is a normal feature of live surveillance data.
Previous reports
Reports for previous years:
- 2024 Statewide Acute Respiratory infection (Influenza, RSV and COVID-19) Surveillance report (PDF 2067 kB)
- 2023 Statewide Acute Respiratory infection (Influenza, RSV and COVID-19) Surveillance report (PDF 1470 kB)
- 2022 Statewide weekly influenza surveillance report (PDF 446 kB)
- 2020 Statewide weekly influenza surveillance report (PDF 879 kB)
- 2019: Statewide weekly influenza surveillance report (PDF 2116 kB)
- 2018: Statewide weekly influenza surveillance report (PDF 847 kB)
- 2017: Statewide weekly influenza surveillance report (PDF 1195 kB)
Influenza in Queensland – 2013 - 2018 (PDF 1080 kB)
Additional information
Contact us if you have queries about Queensland reports or require copies of earlier Queensland reports.